Live condition monitoring

Know the live state of every asset.

One integrated front-end over SCADA, BMS, EMS, supplier portals and every connected asset, presenting meaningful events in context, and catching what your source systems miss.

Energy network

Wind turbine
1.25 MW
Substation
1.87 MW in
Solar park
172 kW
Battery storage
320 kW · 46%
Site consumption 2.64 MW
Grid
Importing
Net power 1.87 MW
ATO quarter-hour 73%
ATO exceedances 0 / 1
Solar
String 7 low
PV power 172 kW
Irradiance 508 W/m²
String availability 87.5%
Battery
Charging
Power 320 kW
Available power 764 kW
State of charge 46.0%
Grid exchange
1.87 MW
importing · ATO 73%
ATO headroom
680 kW
this quarter-hour
Renewable output
1.42 MW
wind + PV
Charging demand
940 kW
6 of 8 bays active
Grid connection
OK
for 20 days
BESS
OK
for 2 days
PV
Warning
for 8 minutes
Wind
OK
for 14 days

ATO contract

Max. import
2,500 kWh/qh
Max. export
1,500 kWh/qh
Max. exceedances
1 /period
Peak today
1.87 MW

Active events

  • WARNING PV string 7 below expected yield 8m
  • INFO Charging bay 4 — session completed 12m
  • AI Import peak expected 16:30 — pre-charge BESS to stay under ATO 3m
customers

Trusted by teams running critical operations

Enterprises across energy, heat, water and infrastructure rely on Blockbax to keep critical assets running.

"By automating tasks and improving productivity, we're prepared to support Eneco's asset growth strategy across our full portfolio."

Michel Klaasse
Michel Klaasse Head of Asset Control & Steering

"Blockbax is key to operating our heat networks at the highest standard, with full control over asset performance across all sources."

Harold Maasen
Harold Maasen Manager of Realisation, Operations & Asset Management

"With Blockbax, our maintenance and operations teams have real-time insight into our full fleet of energy solutions."

Noël Steentjes
Noël Steentjes Technical Director
Firan Eteck Heijmans Elix Nett Eneco Bredenoord TBI Van der Ende Group Gemeente Rotterdam Volta Energy Aquon Gigastorage Inwarmte Electroproject Caeli Additive Restrain

One integrated view, across
every source system

Stop switching between twenty systems to understand one situation.

Consolidate events, statuses and external context into a single operational front-end, structured along your asset hierarchy.

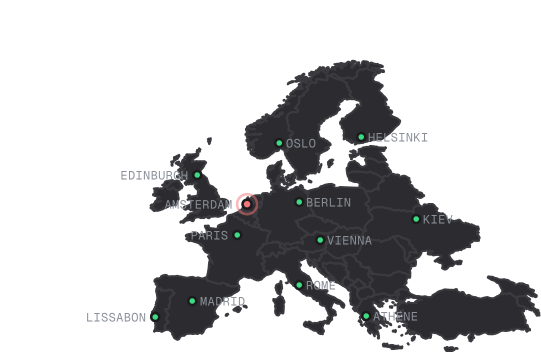
Map of Europe with monitored sites in Edinburgh, Oslo, Helsinki, Amsterdam, Berlin, Vienna, Kiev, Paris, Madrid, Lisbon and Athens. Amsterdam shows a problem; a truck drives from Madrid to Amsterdam through a geofence around Paris, and a vessel sails across the North Sea.

Every asset on one map

Live status on maps and schematics, colored by severity. Zoom from the national picture to a single substation, and open its dashboard in one click.

  • Operating normally
  • Warning
  • Problem
  • Moving asset
  • Geofence
142 Assets monitored
8 Sites
3 Active alarms
5 Active operators

One source of truth

Every important data source in one front-end, structured on your asset model instead of each vendor's.

  • Asset control & management systems SCADA · BMS · EMS · EAM
  • Streaming data platforms Kafka · Event Hub · Kinesis
  • Gateways & OEM portals field gateways · OEM clouds
  • Service management systems ITSM · ticketing
One live view on your asset model

Context on the asset

Drawings, maintenance history and the right contact sit on the asset itself, not in a folder somewhere else.

  • — available
  • — due soon
  • — off shift
  • — up to date

External context

Weather, passenger flow, traffic and market prices sit alongside the measurement, not in a separate report.

Weather
storm 16:00
Passengers
429 in
Grid price
€184/MWh

Enriched onto the asset, so the reading has meaning.

Catch every condition, even the silent ones

What deserves attention right now, given everything else happening.

One uniform lifecycle across every alarm source, with the prioritization and noise control a busy operation needs.

Rule conditions

Thresholds come from asset properties instead of hard-coded values, so one rule covers thousands of assets and each one is judged against its own limits.

Threshold from asset property: sensor value rising in a smooth curve and breaching the asset's threshold at 15 minutes.THRESHOLD FROM ASSET PROPERTYbreach at 15 min
Cross-asset rules Custom

Combine conditions across different asset types in a single rule, so an event reflects the real operational situation rather than one isolated signal.

Inverter output 0 kW
BMS Setpoint 500 kW
AND
Silent failure No overt alarm raised
Deviation from expected

Live output checked against its setpoint, forecast or per-asset limits.

Expected setpoint versus actual output: actual output starts near the expected setpoint, then drifts steadily downward and away from it.expected (setpoint)actual output drifts away
Missing-data detection

Scheduled checks notify you when an asset goes quiet, even with no data arriving.

Last measurement, then nothing for 1 hour: the scheduled check still fires anyway.last measurementnothing for 1 hourscheduled check fires anyway
Rule scheduling

Active only on the days and shifts that matter, so nobody is paged for a planned stop.

  • Mon — active
  • Tue — active
  • Wed — active
  • Thu — active
  • Fri — active
  • Sat — inactive
  • Sun — inactive

Rule active weekdays 08:00 to 22:00 only.

A second pair of expert eyes,
always on

Ask what the live data means, and what to do about it.

AI answers in natural language, grounded in your asset data, manuals and history, and surfaces issues before they become alarms.

  • Natural-language questions: answered from live data, with cited sources
  • Context-aware follow-up: suggestions drawn from event history
  • Proactive surfacing: spots anomalies before they trip a threshold
Explore the AI Agent
AI agent Heat pump A · District Heating

Why is heat pump A's COP trending down since Tuesday?

COP dropped 8% after source temp fell below 10°C. The same pattern in January was resolved by raising the flow setpoint. The filter is also due in 12 days.

Suggested actions
Sources: 3 metrics · 1 incident