Asset performance & reliability

Know what underperforms, before it costs you.

Measure, benchmark and improve performance and reliability across the fleet, and hold OEMs and contracts to account with availability numbers you can defend.

Asset portfolioWind park North · 8 turbines
Period: This month

Capacity factor by turbine

ranked against expected for current wind

Expected capacity factor for current wind: 38%. Scale 0 to 50%.

  1. T-01 41.2%
  2. T-02 40.6%
  3. T-04 39.8%
  4. T-05 39.1%
  5. T-06 38.7%
  6. T-07 37.9%
  7. T-08 37.4%
  8. T-03 29.3% , underperforming

T-03 is 9 points below its peers under the same wind conditions.

Availability against contract

89.4% −3.6 pts

Availability 89.4% against an OEM contract of 93%.

3.6 percentage points below the OEM agreement

Early warning AI prediction

T-03 gearbox likely to fail within 11 days

Same profile preceded 3 earlier failures

customers

Trusted by teams running critical operations

Enterprises across energy, heat, water and infrastructure rely on Blockbax to keep critical assets running.

"By automating tasks and improving productivity, we're prepared to support Eneco's asset growth strategy across our full portfolio."

Michel Klaasse
Michel Klaasse Head of Asset Control & Steering

"Blockbax is key to operating our heat networks at the highest standard, with full control over asset performance across all sources."

Harold Maasen
Harold Maasen Manager of Realisation, Operations & Asset Management

"With Blockbax, our maintenance and operations teams have real-time insight into our full fleet of energy solutions."

Noël Steentjes
Noël Steentjes Technical Director
Firan Eteck Heijmans Elix Nett Eneco Bredenoord TBI Van der Ende Group Gemeente Rotterdam Volta Energy Aquon Gigastorage Inwarmte Electroproject Caeli Additive Restrain

Benchmark the asset portfolio, drill into the outlier

See which assets underperform, and by how much.

Calculated KPIs and layered aggregation turn raw signals into the metrics your asset managers actually steer on.

Calculated KPIs

Availability, capacity factor, performance ratio or COP, calculated live from raw signals instead of rebuilt in a spreadsheet every month.

Capacity factor · Wind
38.4%
Performance ratio · Solar
84.2%
COP · Heat Pump
4.2
MTBF · Escalators
1,240 h
Portfolio benchmarking

Two-level aggregation compares like with like: average per asset first, then max or sum per park, brand or network. The outliers surface themselves instead of hiding in an average.

Portfolio benchmark trend, with two assets falling below the curveAsset below benchmark curveAsset below benchmark curve2 ASSETS BELOW CURVE
Contractual reference lines

Warranty levels and guaranteed curves drawn from asset properties, so every asset is judged against its own contract.

Actual performance tracking below the guaranteed curve, converging toward it over timeGuaranteed curveActual performance
Views in your language

Custom widgets render performance as a schematic, a 3D model or a domain summary, not just another chart.

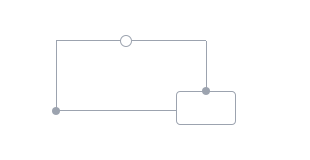
Schematic

Wiring and flow, drawn like an engineering diagram

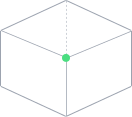
3D Model

The physical asset itself, rotated and inspected in place

From 'what happened' to
'what to do next'

Recommendations that connect performance to known fixes.

AI links a performance dip to maintenance history and forecasts degradation before it becomes downtime.

  • Performance recommendations dips linked to maintenance history
  • Forecast-based early warning ML forecast conditions on key signals
  • Predictive maintenance flag likely failures ahead of time
Explore the AI Agent
AI agent
Predictive note

Bearing vibration trending to threshold in ~11 days. Similar profile preceded 3 past failures. Recommend inspection this cycle.