Docs
Getting started
So, your account has just been activated, or maybe you’re just curious about what Blockbax can do for you. To get started, we provide a high level overview of the platform’s basic functionalities and how it can help you take action on interesting events based on your sensor data.
Concepts
Below you’ll find some key concepts related to the Blockbax Platform. Ranging from dashboards to subjects up to integrations. After reading these you should have a general idea of the terminology and concepts of the Blockbax Platform!
Dashboard
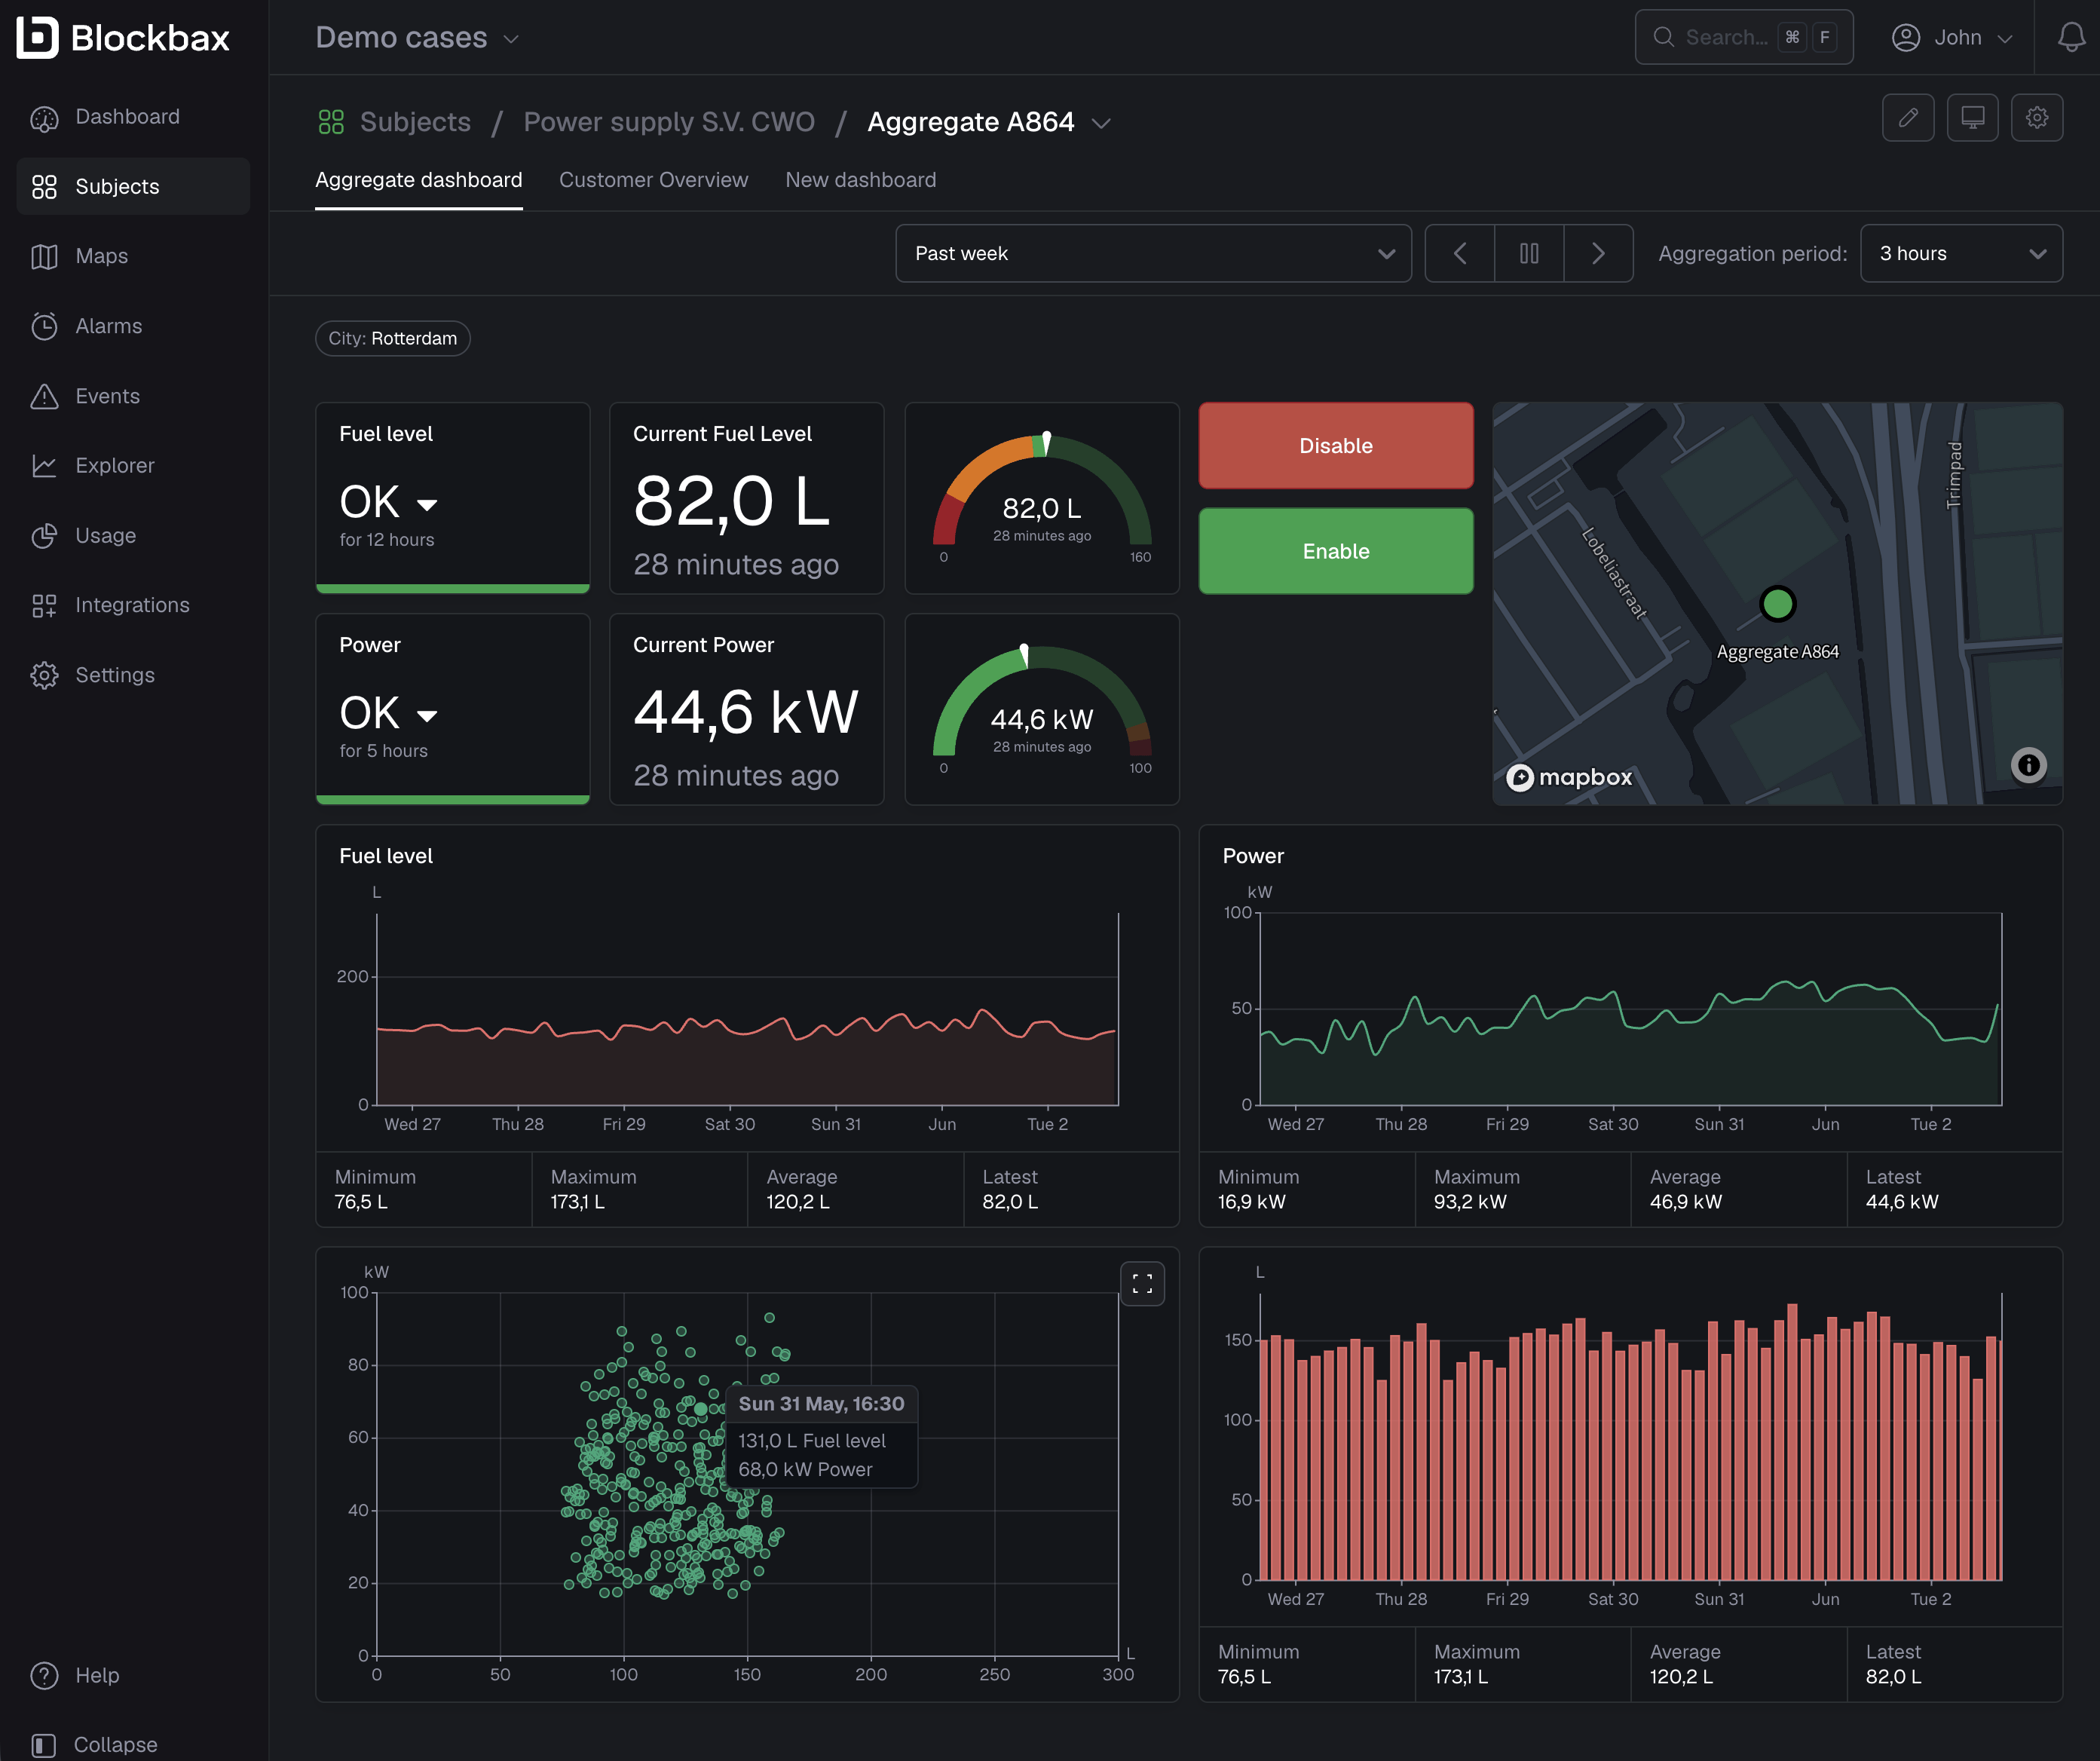
A dashboard summarizes your data with easy-to-understand, real-time data visuals based on measurements and events. It helps you to see the most important information at a glance, so you understand what you are doing right and where you need to take action.
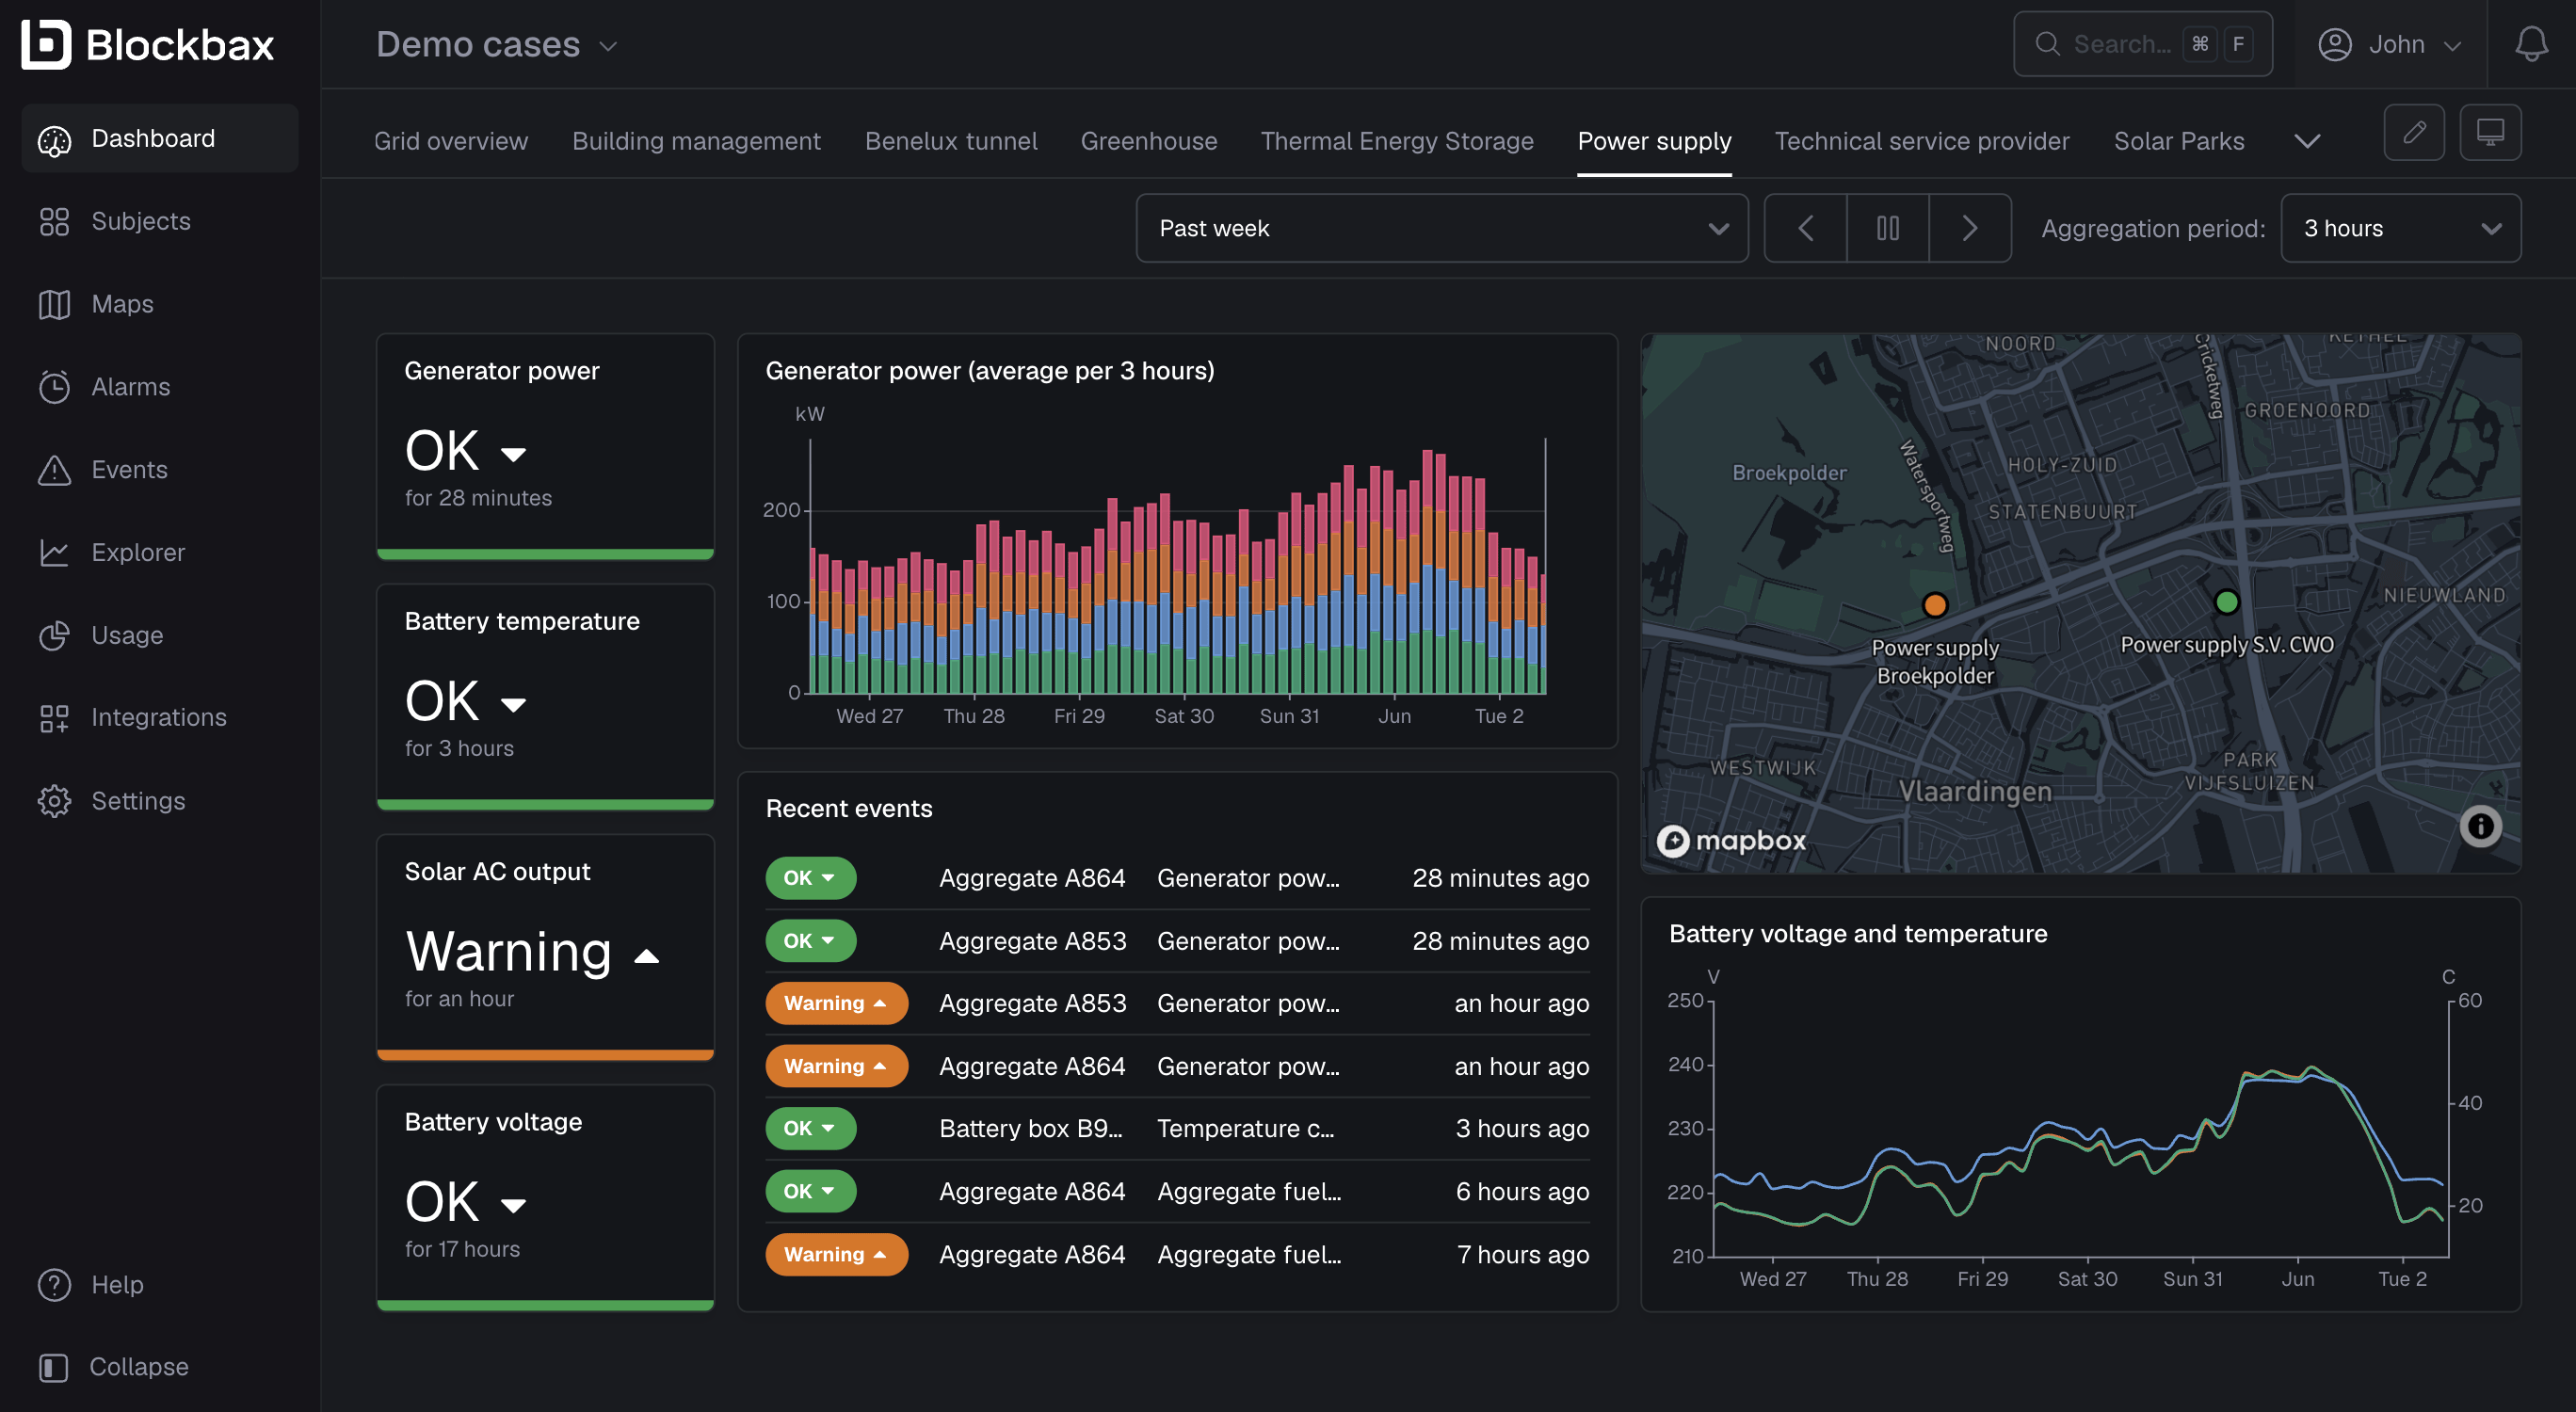
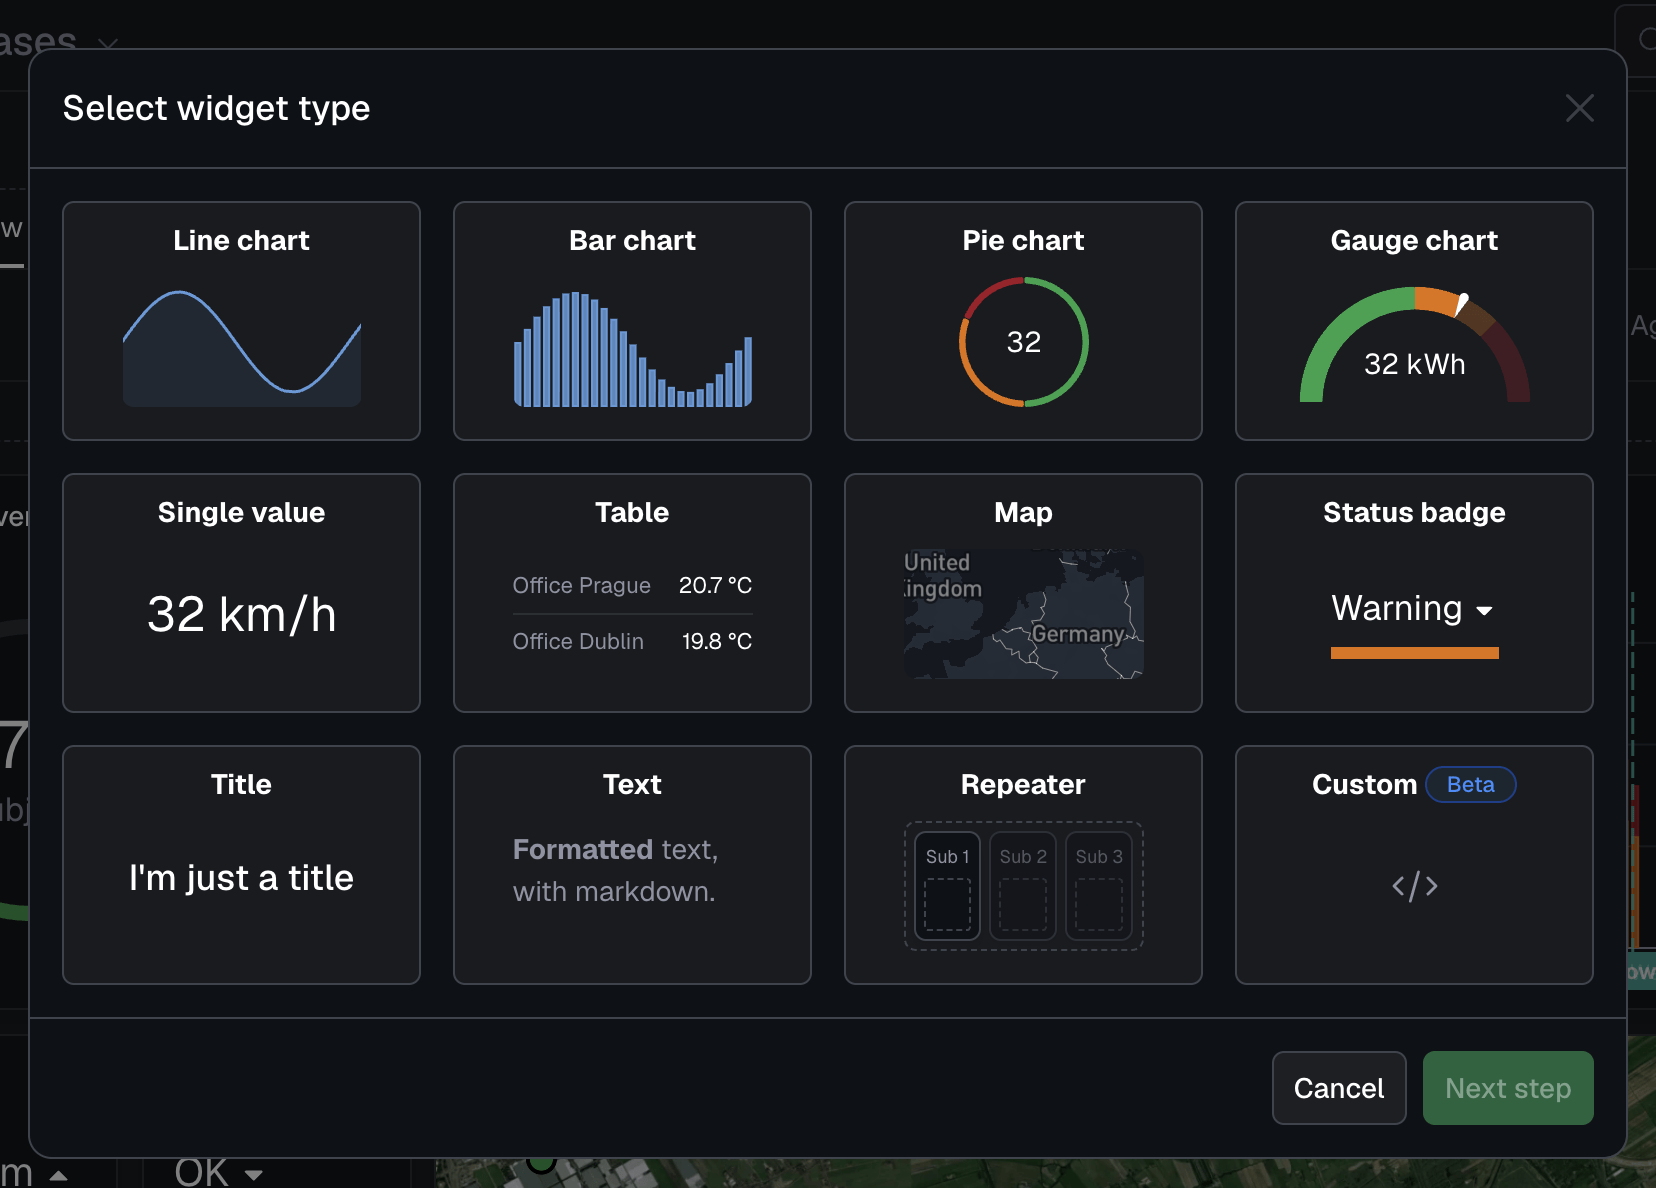
Here you see the set of widgets that can be used to enrich your data into more manageable chunks of visual information that allows you to see what you are doing right and where you need to take action or improve.
For a more detailed overview of the functionalities, please see the dashboard documentation.
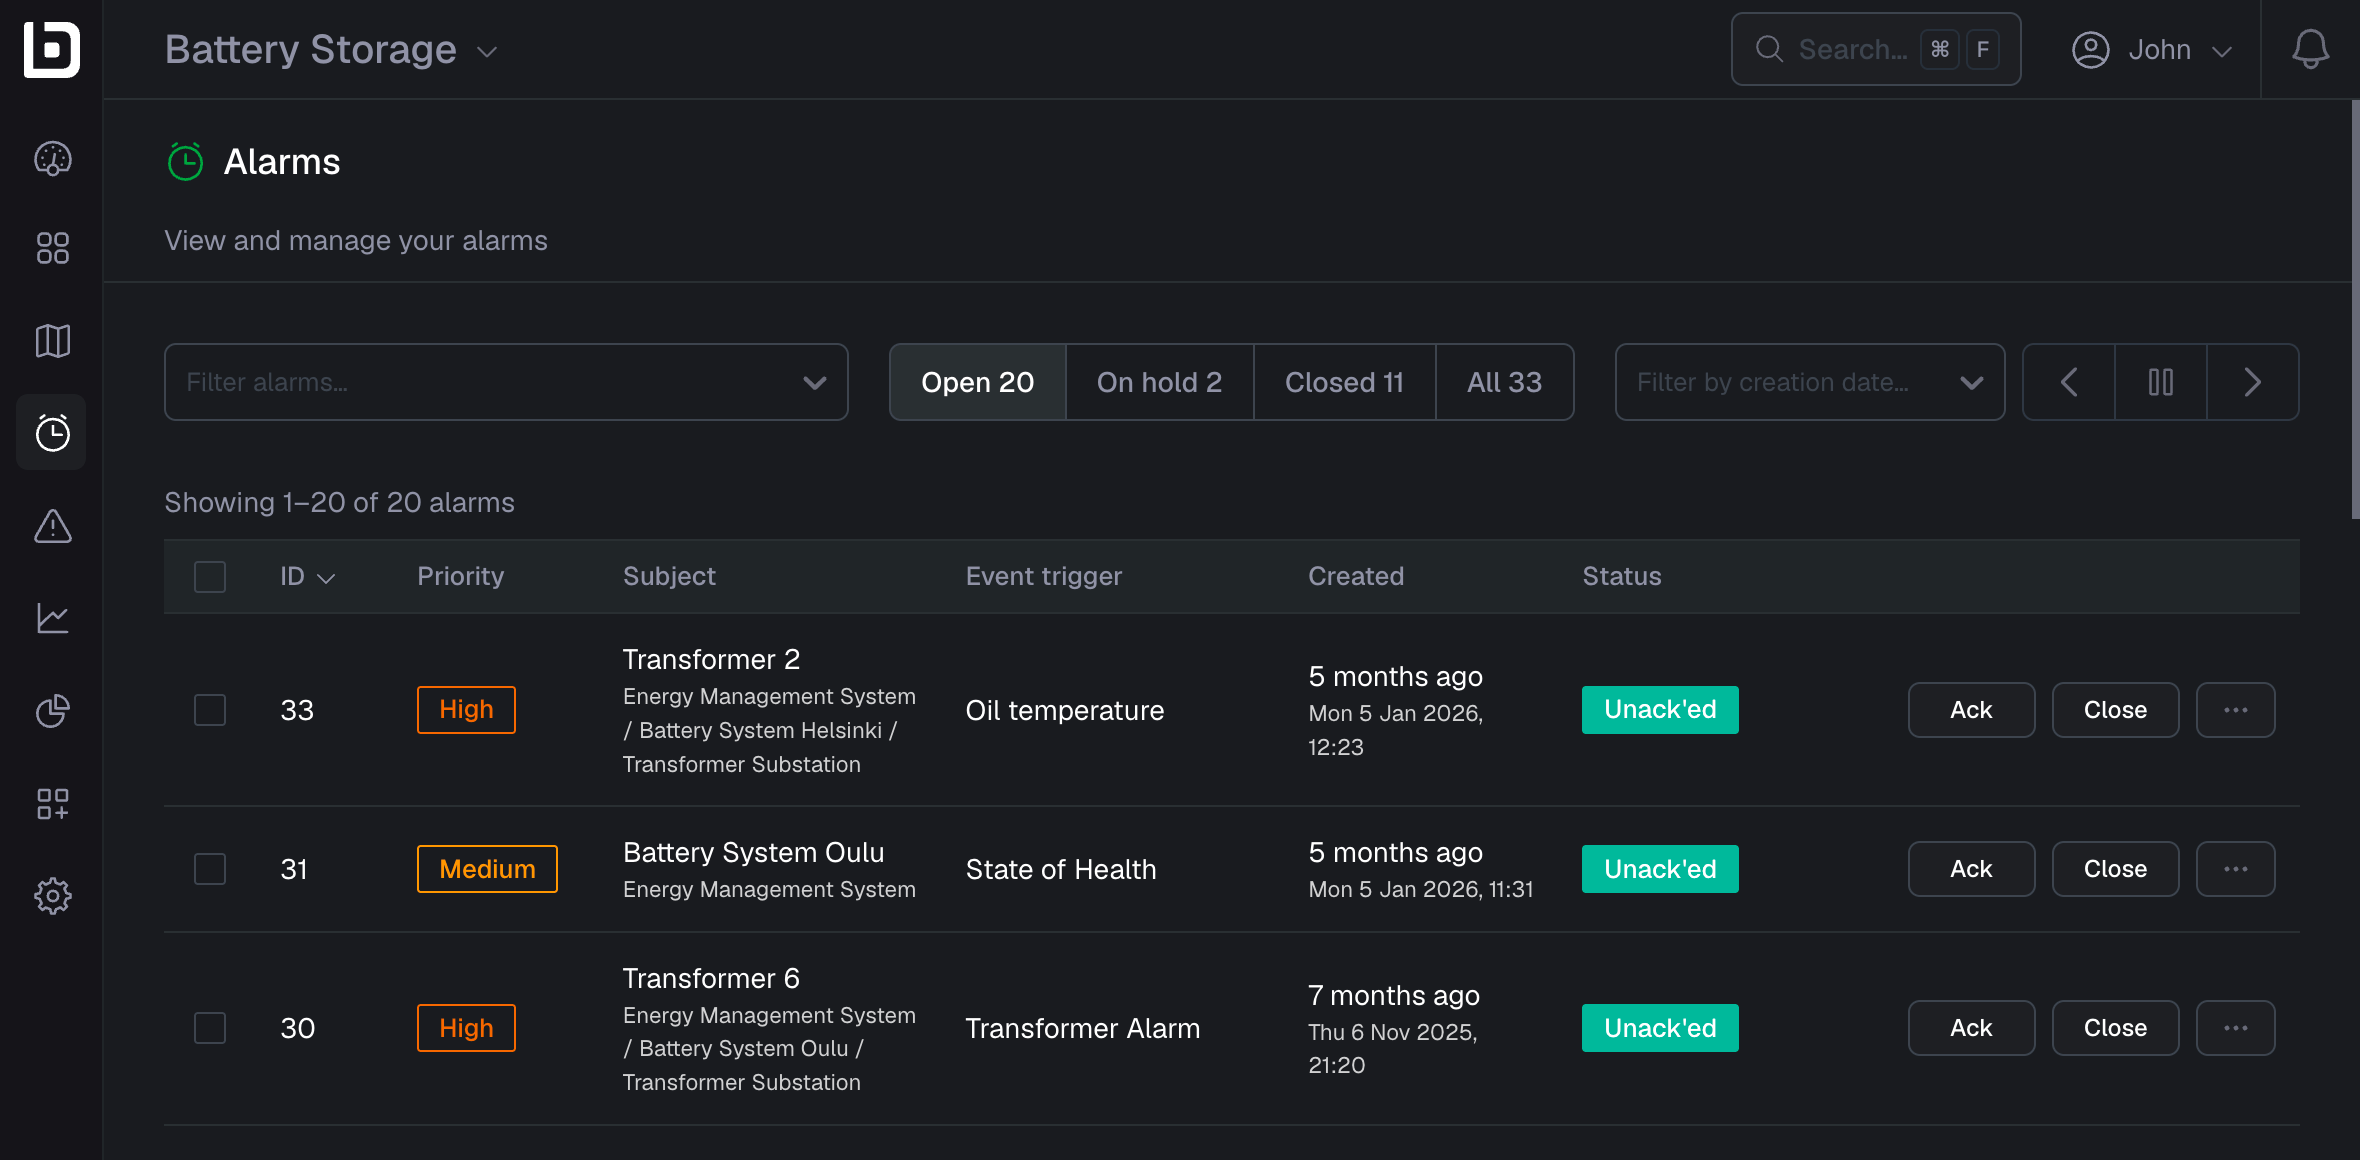
Alarms
An alarm serves as a task for a user to follow up on problematic events. Alarms are created automatically from an event trigger and can be acknowledged, put on hold, or closed as your team works to resolve the underlying issue.
For a more detailed overview of the functionalities, please see the alarms documentation.
Events
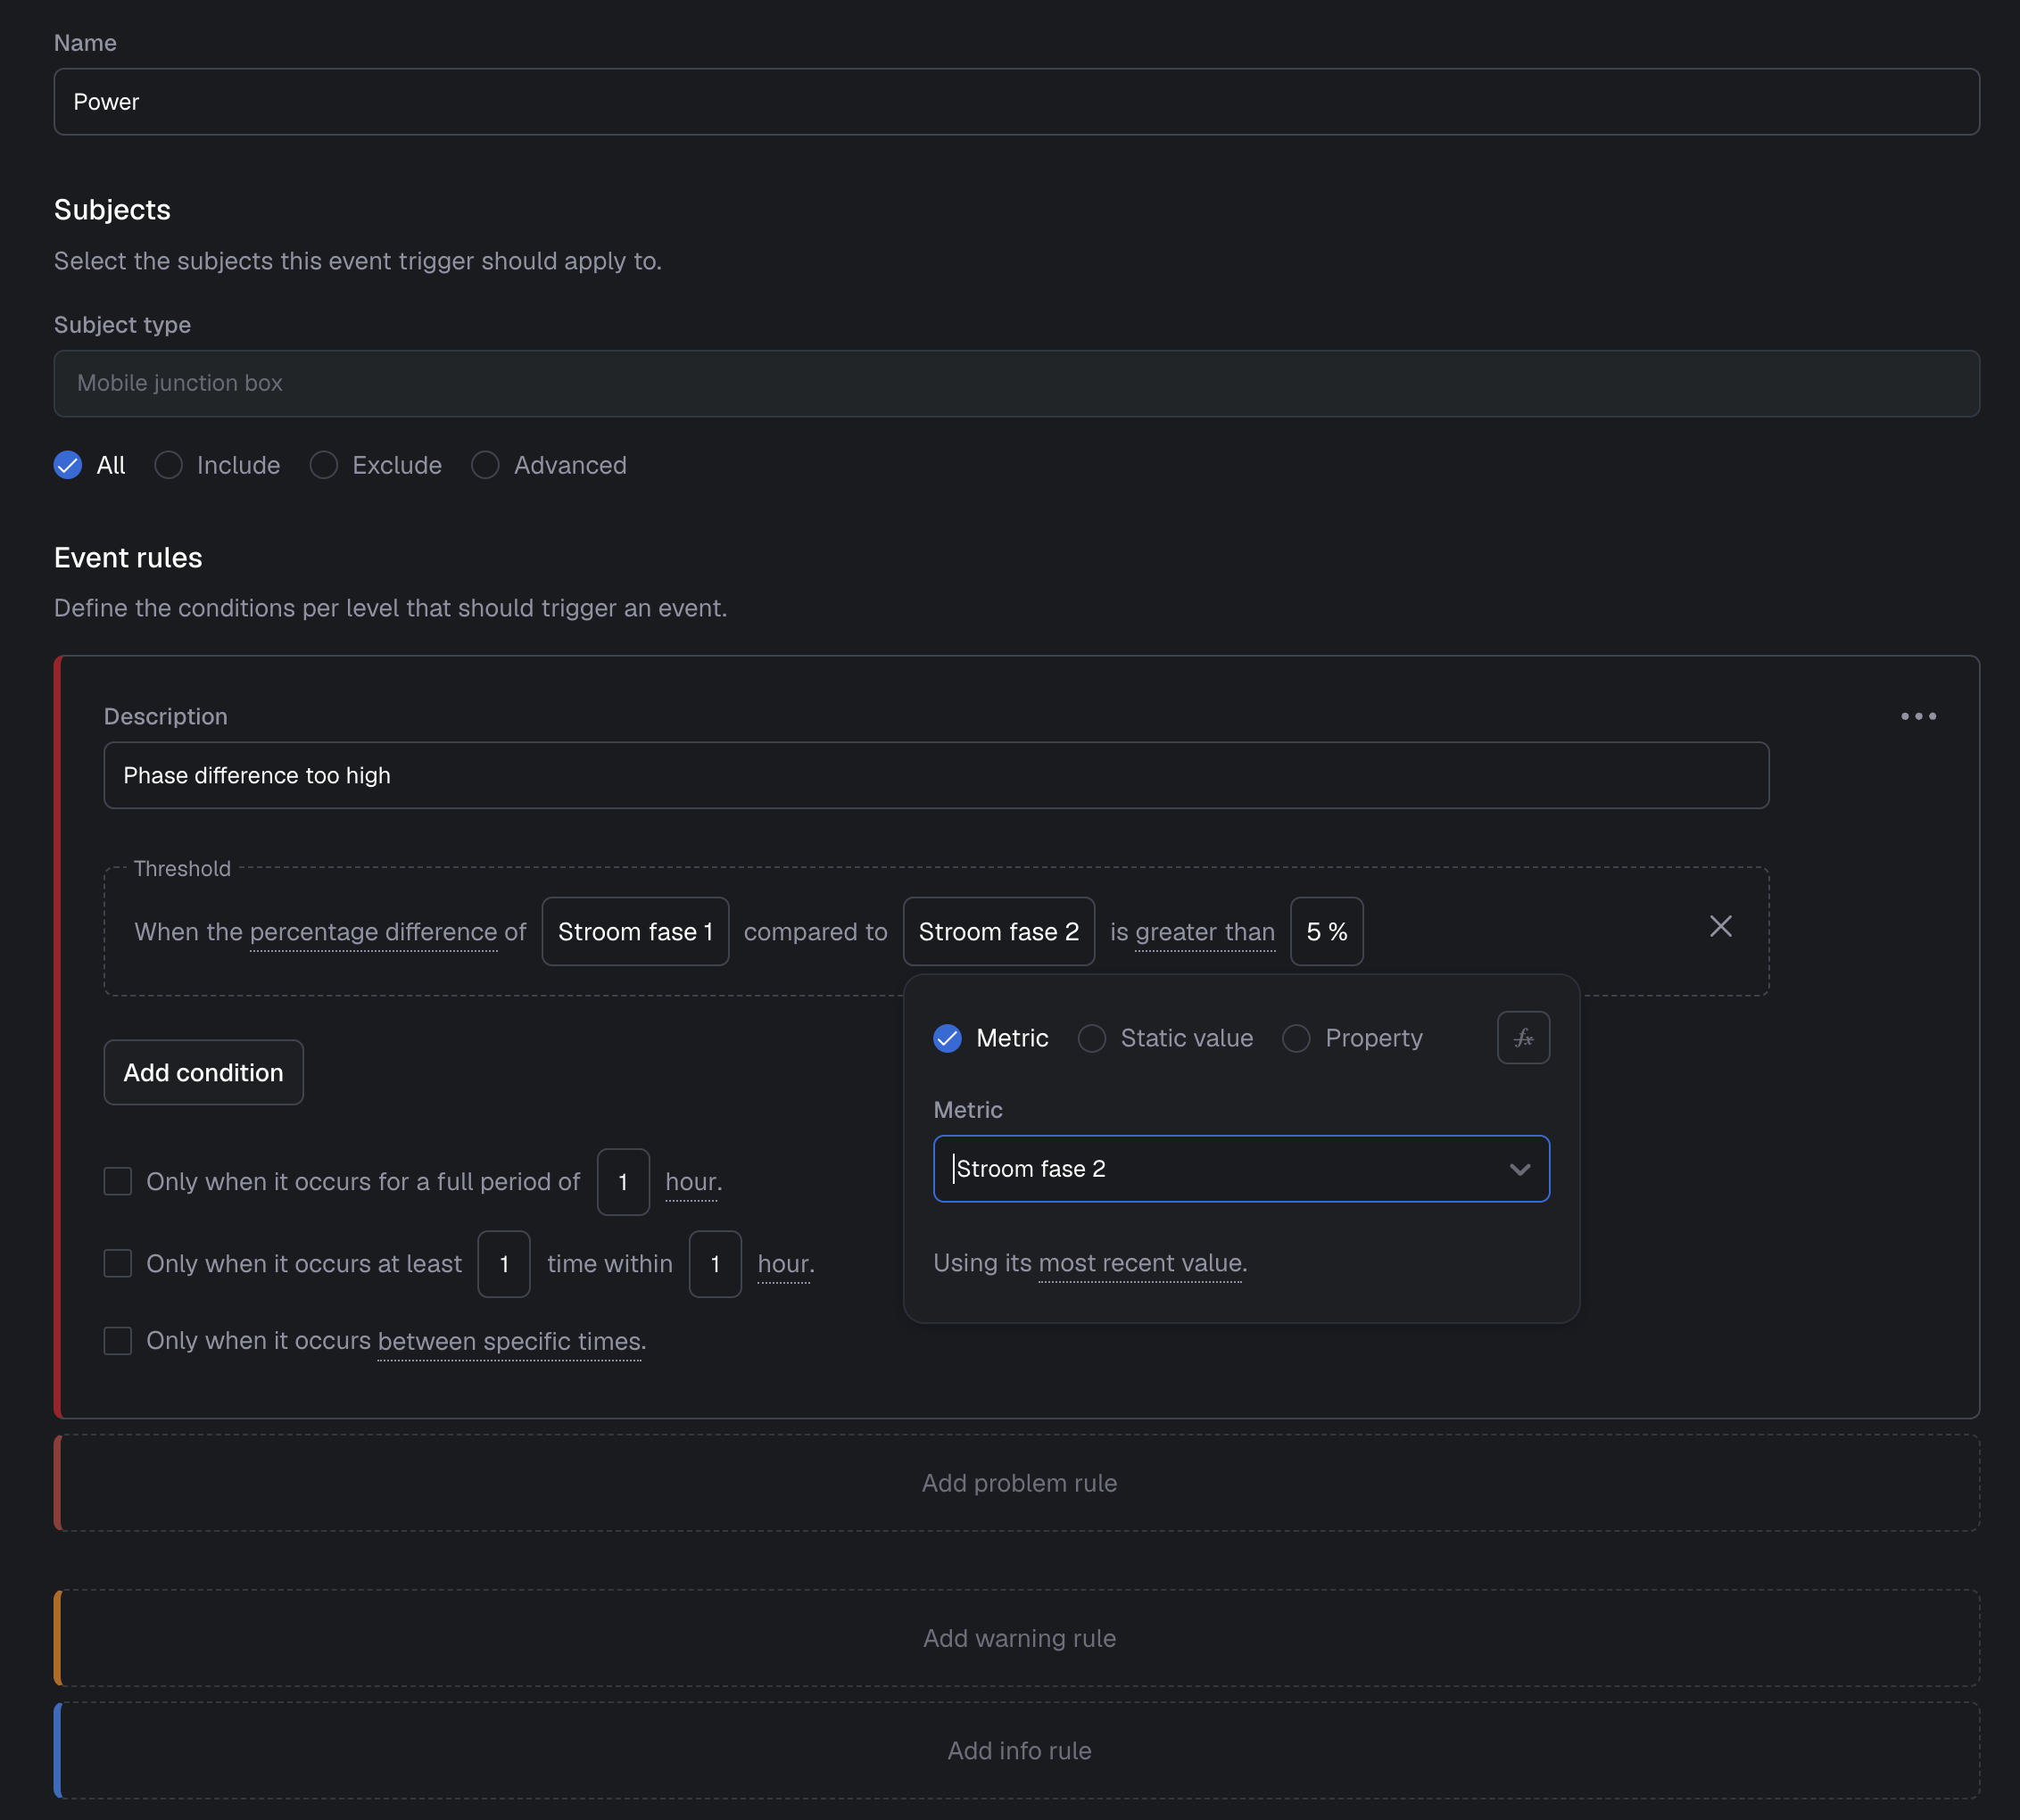
Configure your event triggers in such a way that events are triggered when interesting patterns occur in your measurement data.
For a more detailed overview of Event triggers, please jump to the event trigger documentation.
In the events overview, you can see the events that occurred over time and have the possibility to filter out the ones you are interested in.
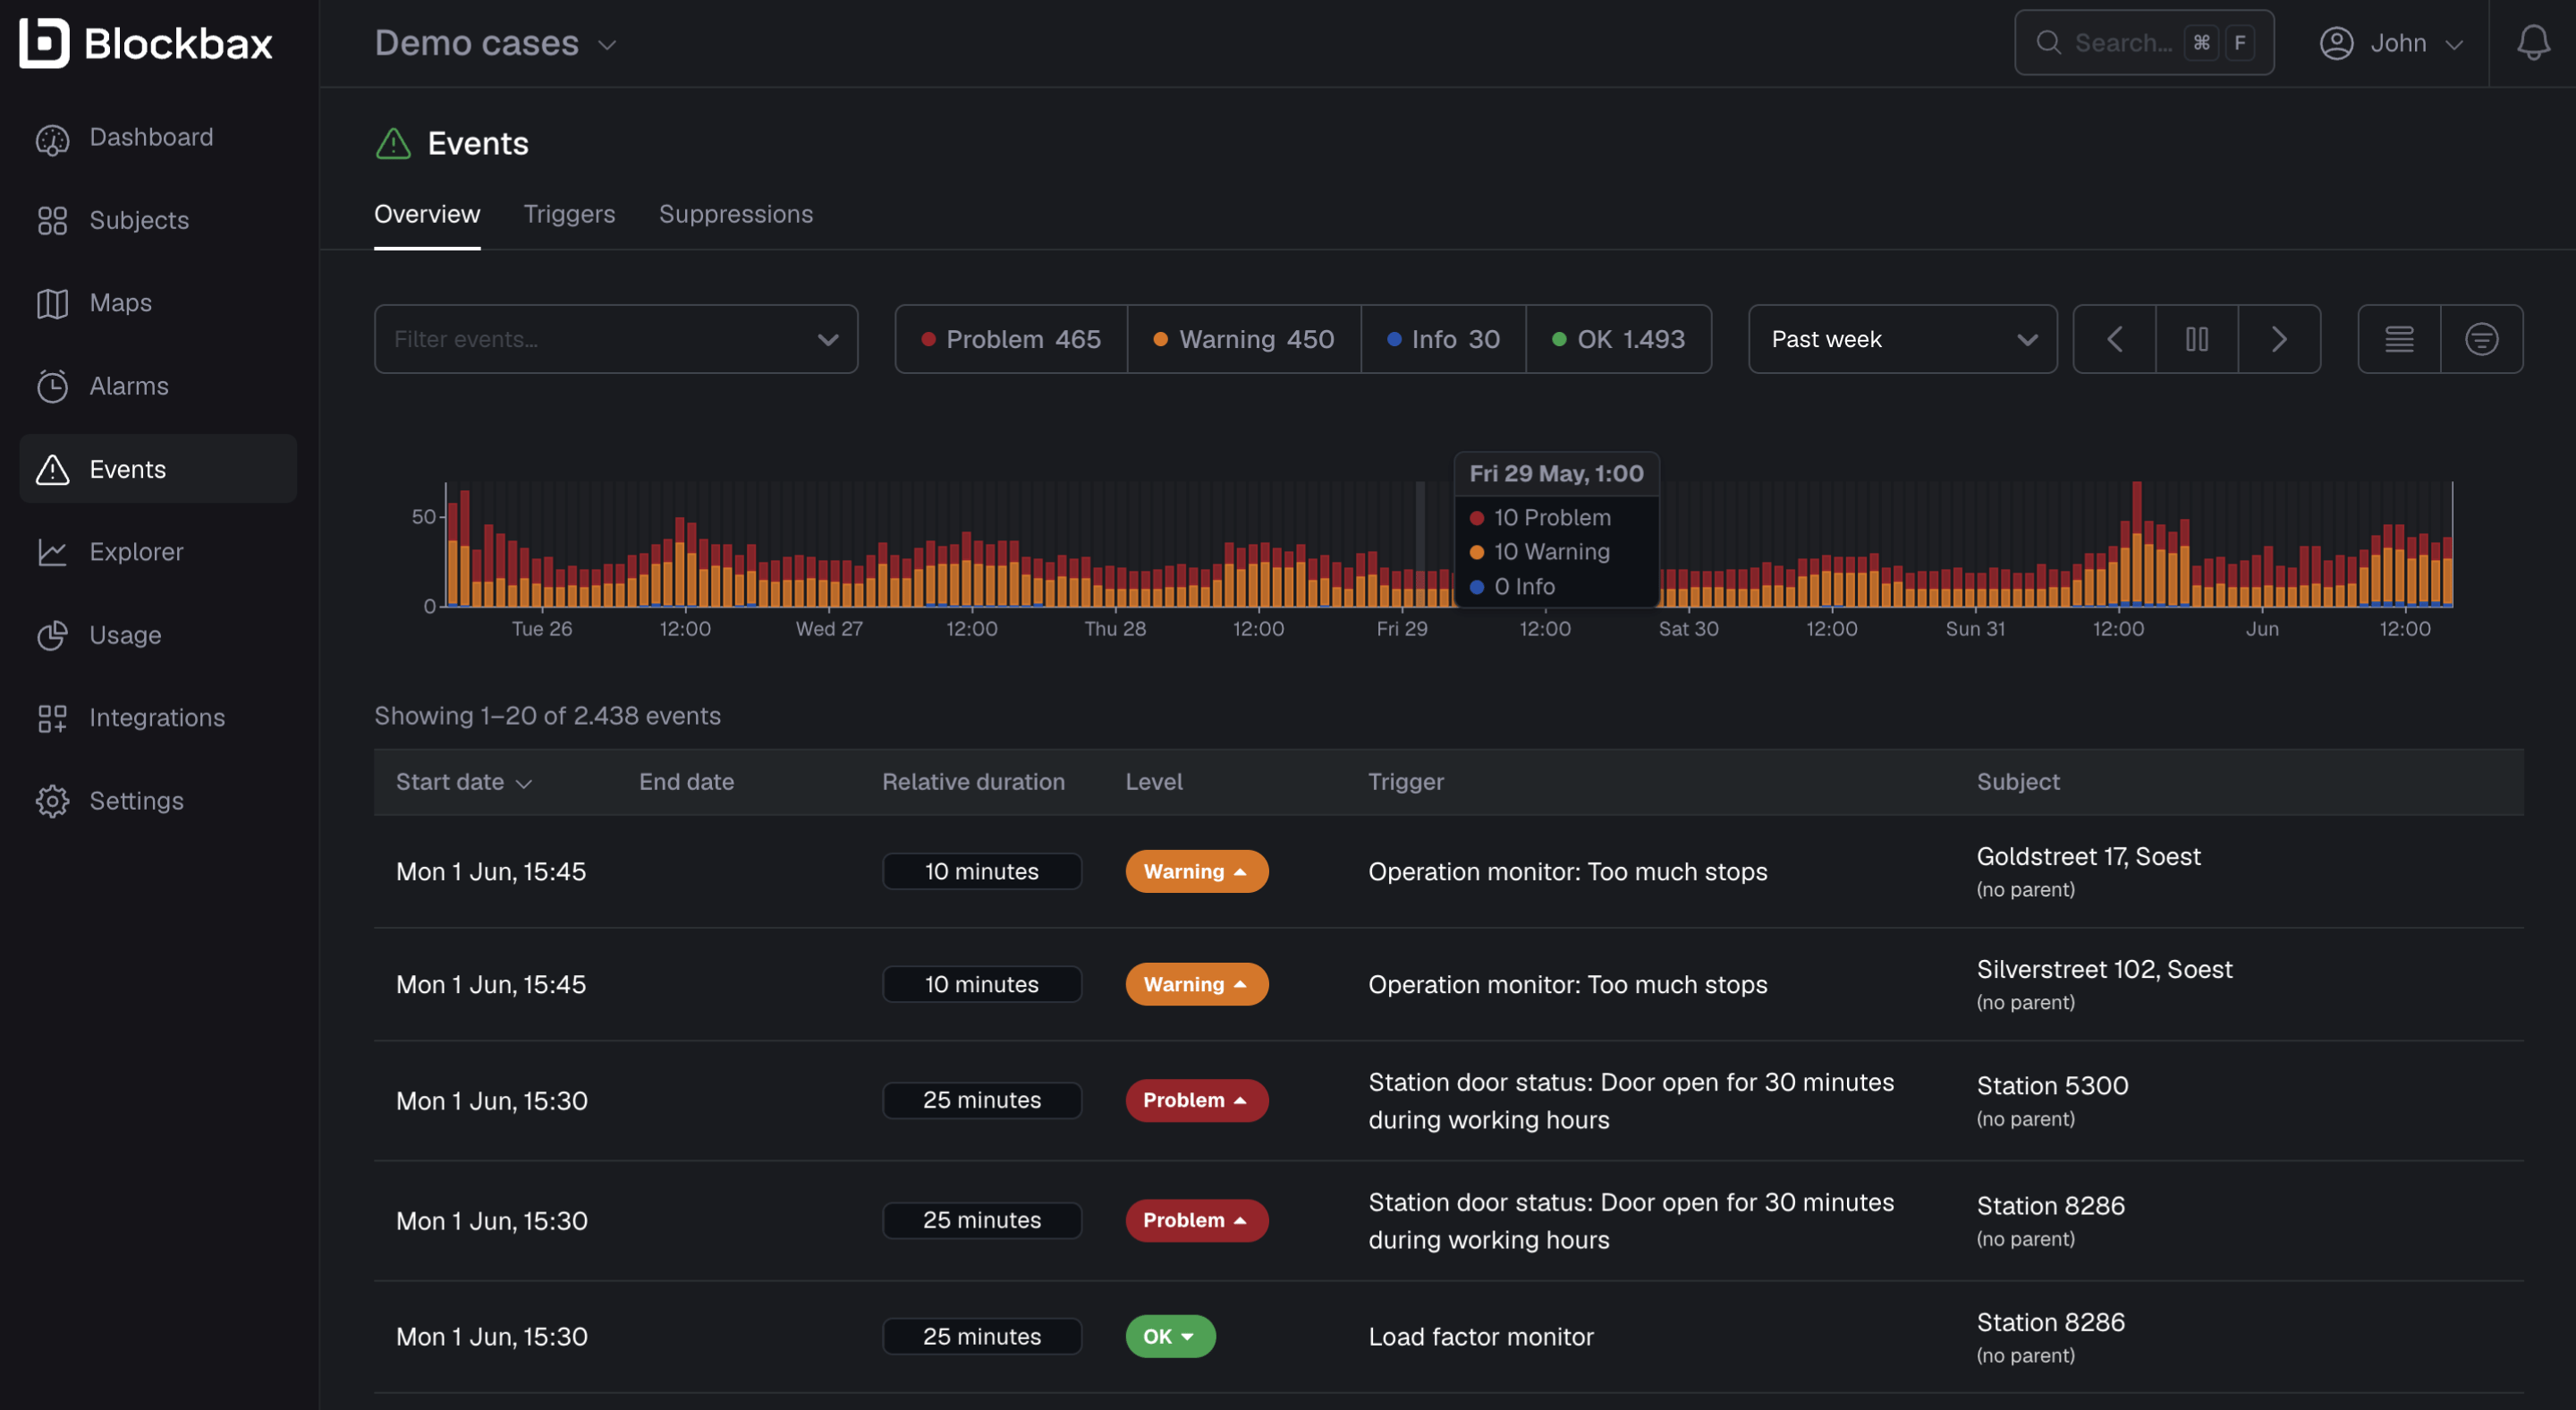
For a more detailed explanation of the events overview, please see the events documentation.
You can click on a specific event to zoom-in and have a better understanding of what happened.
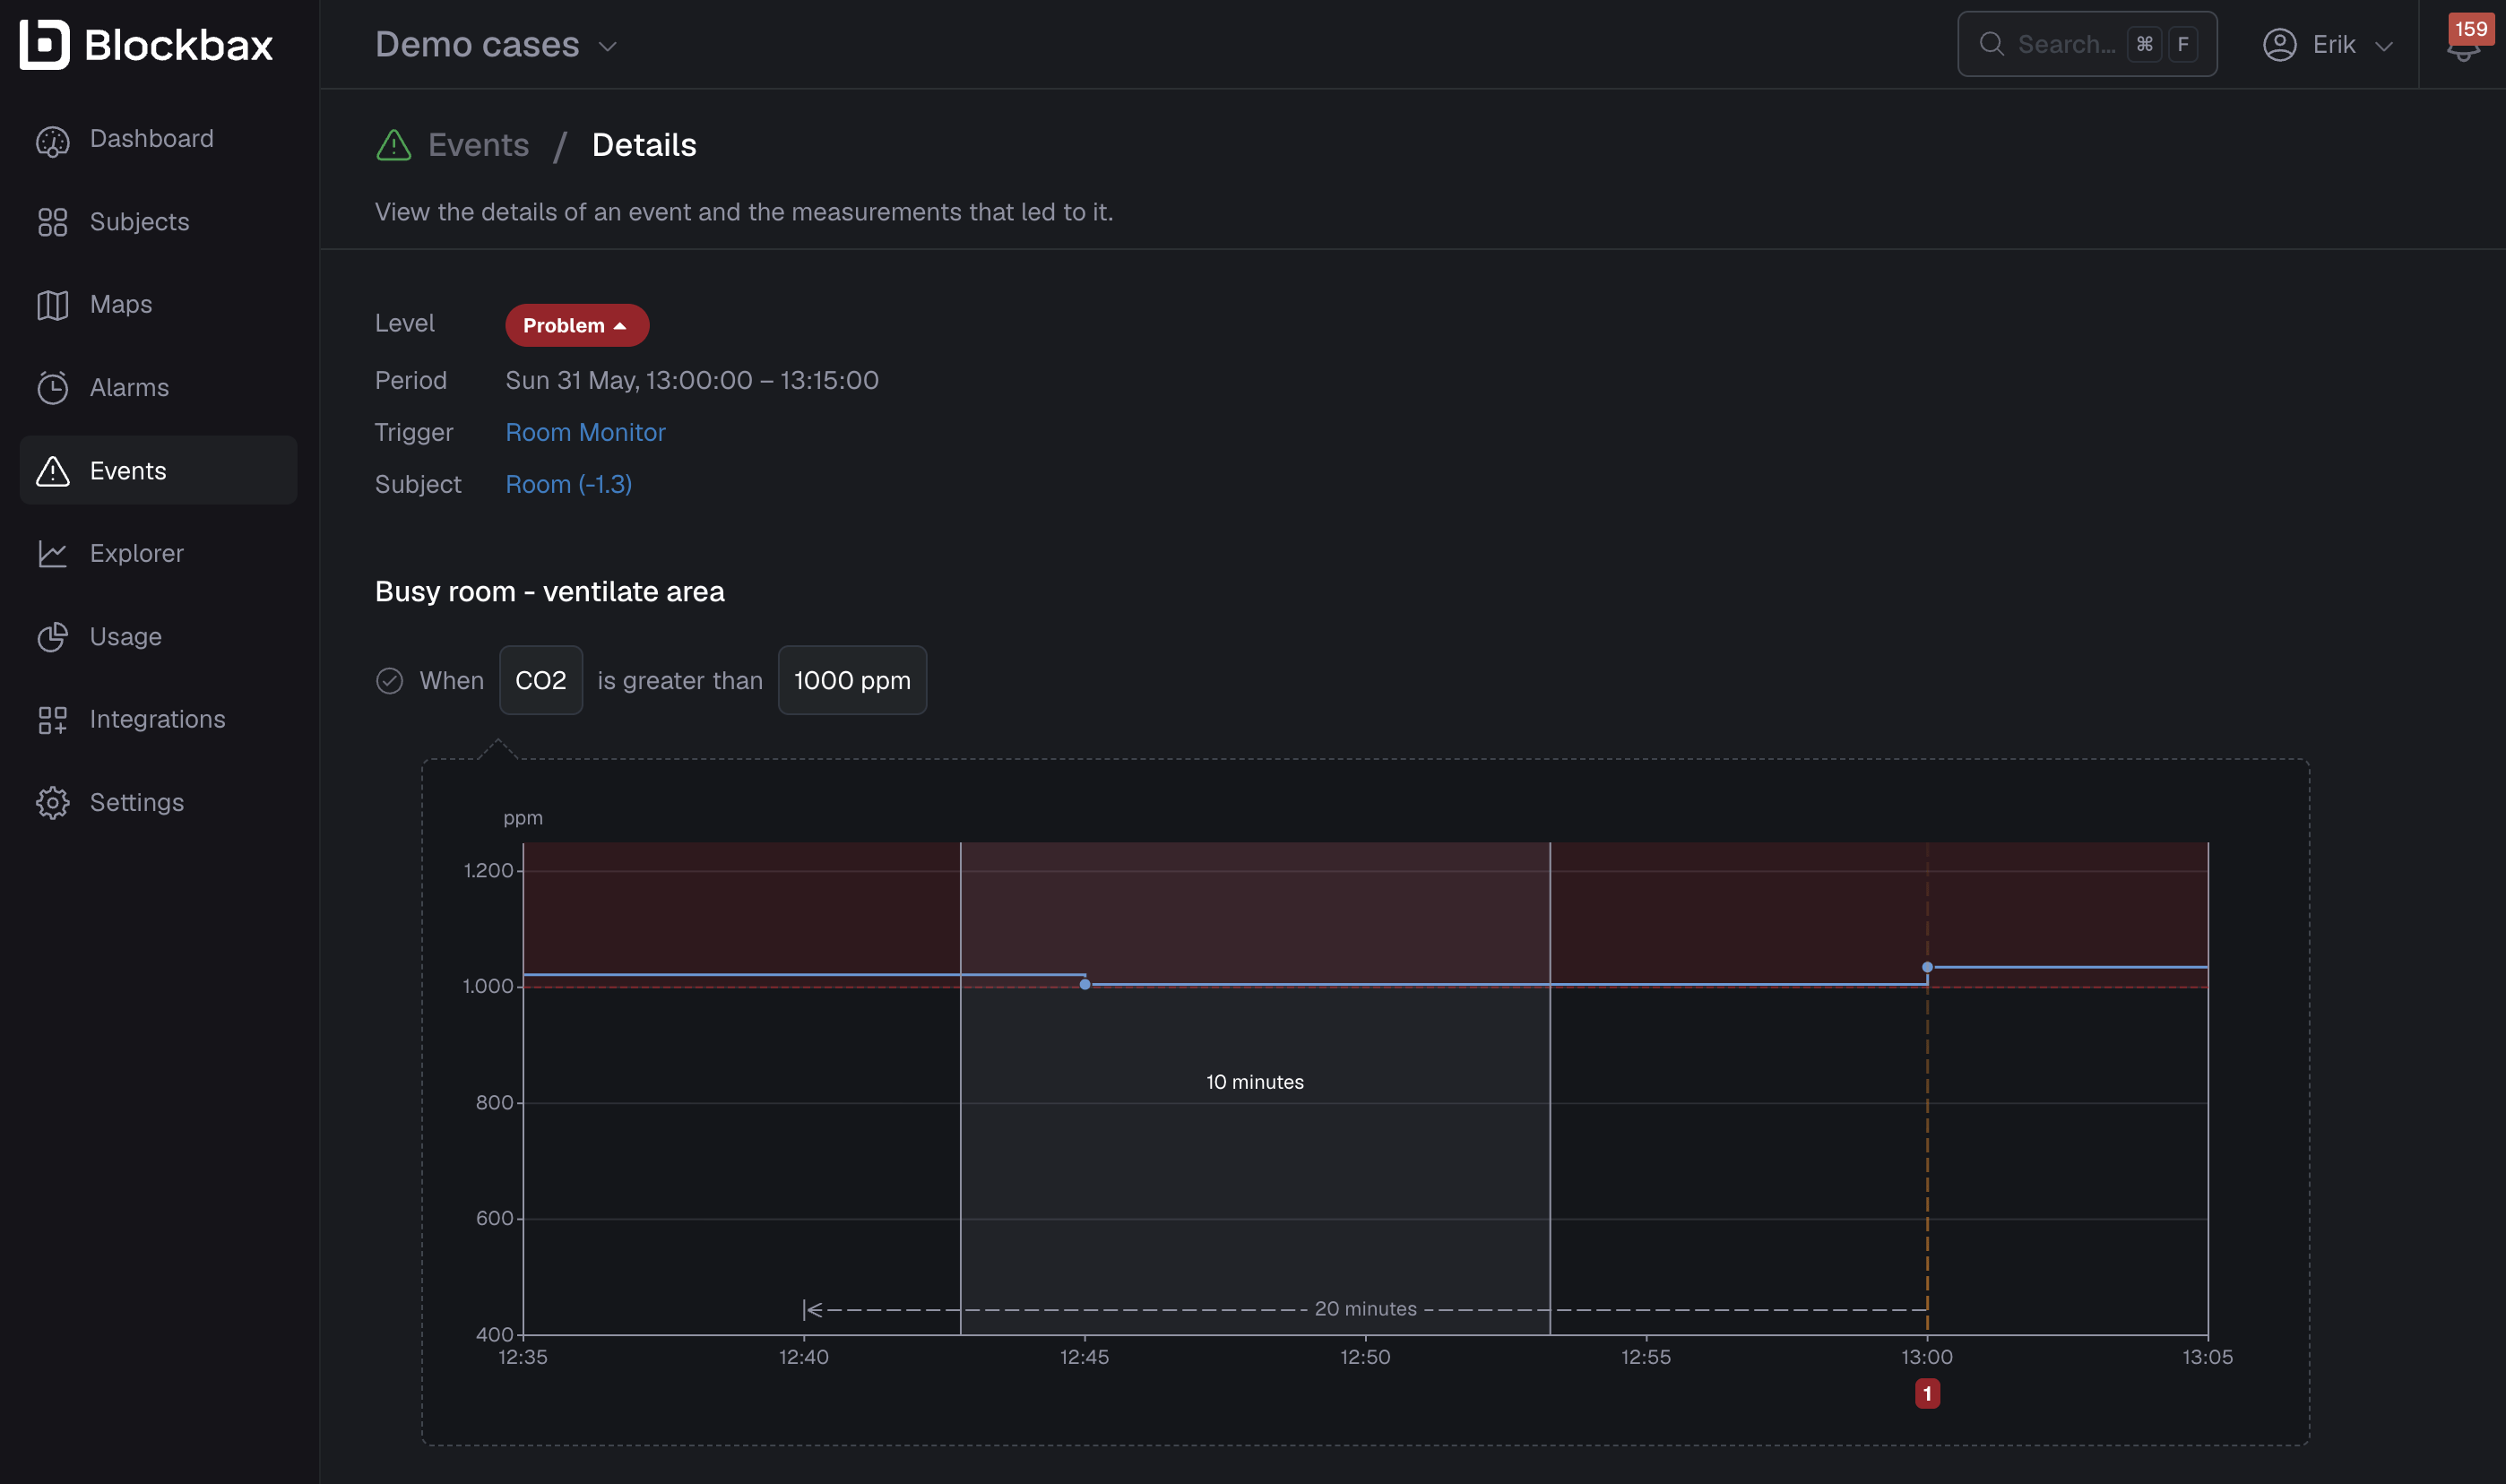
For a more extensive explanation, please see the event details documentation.
Subjects
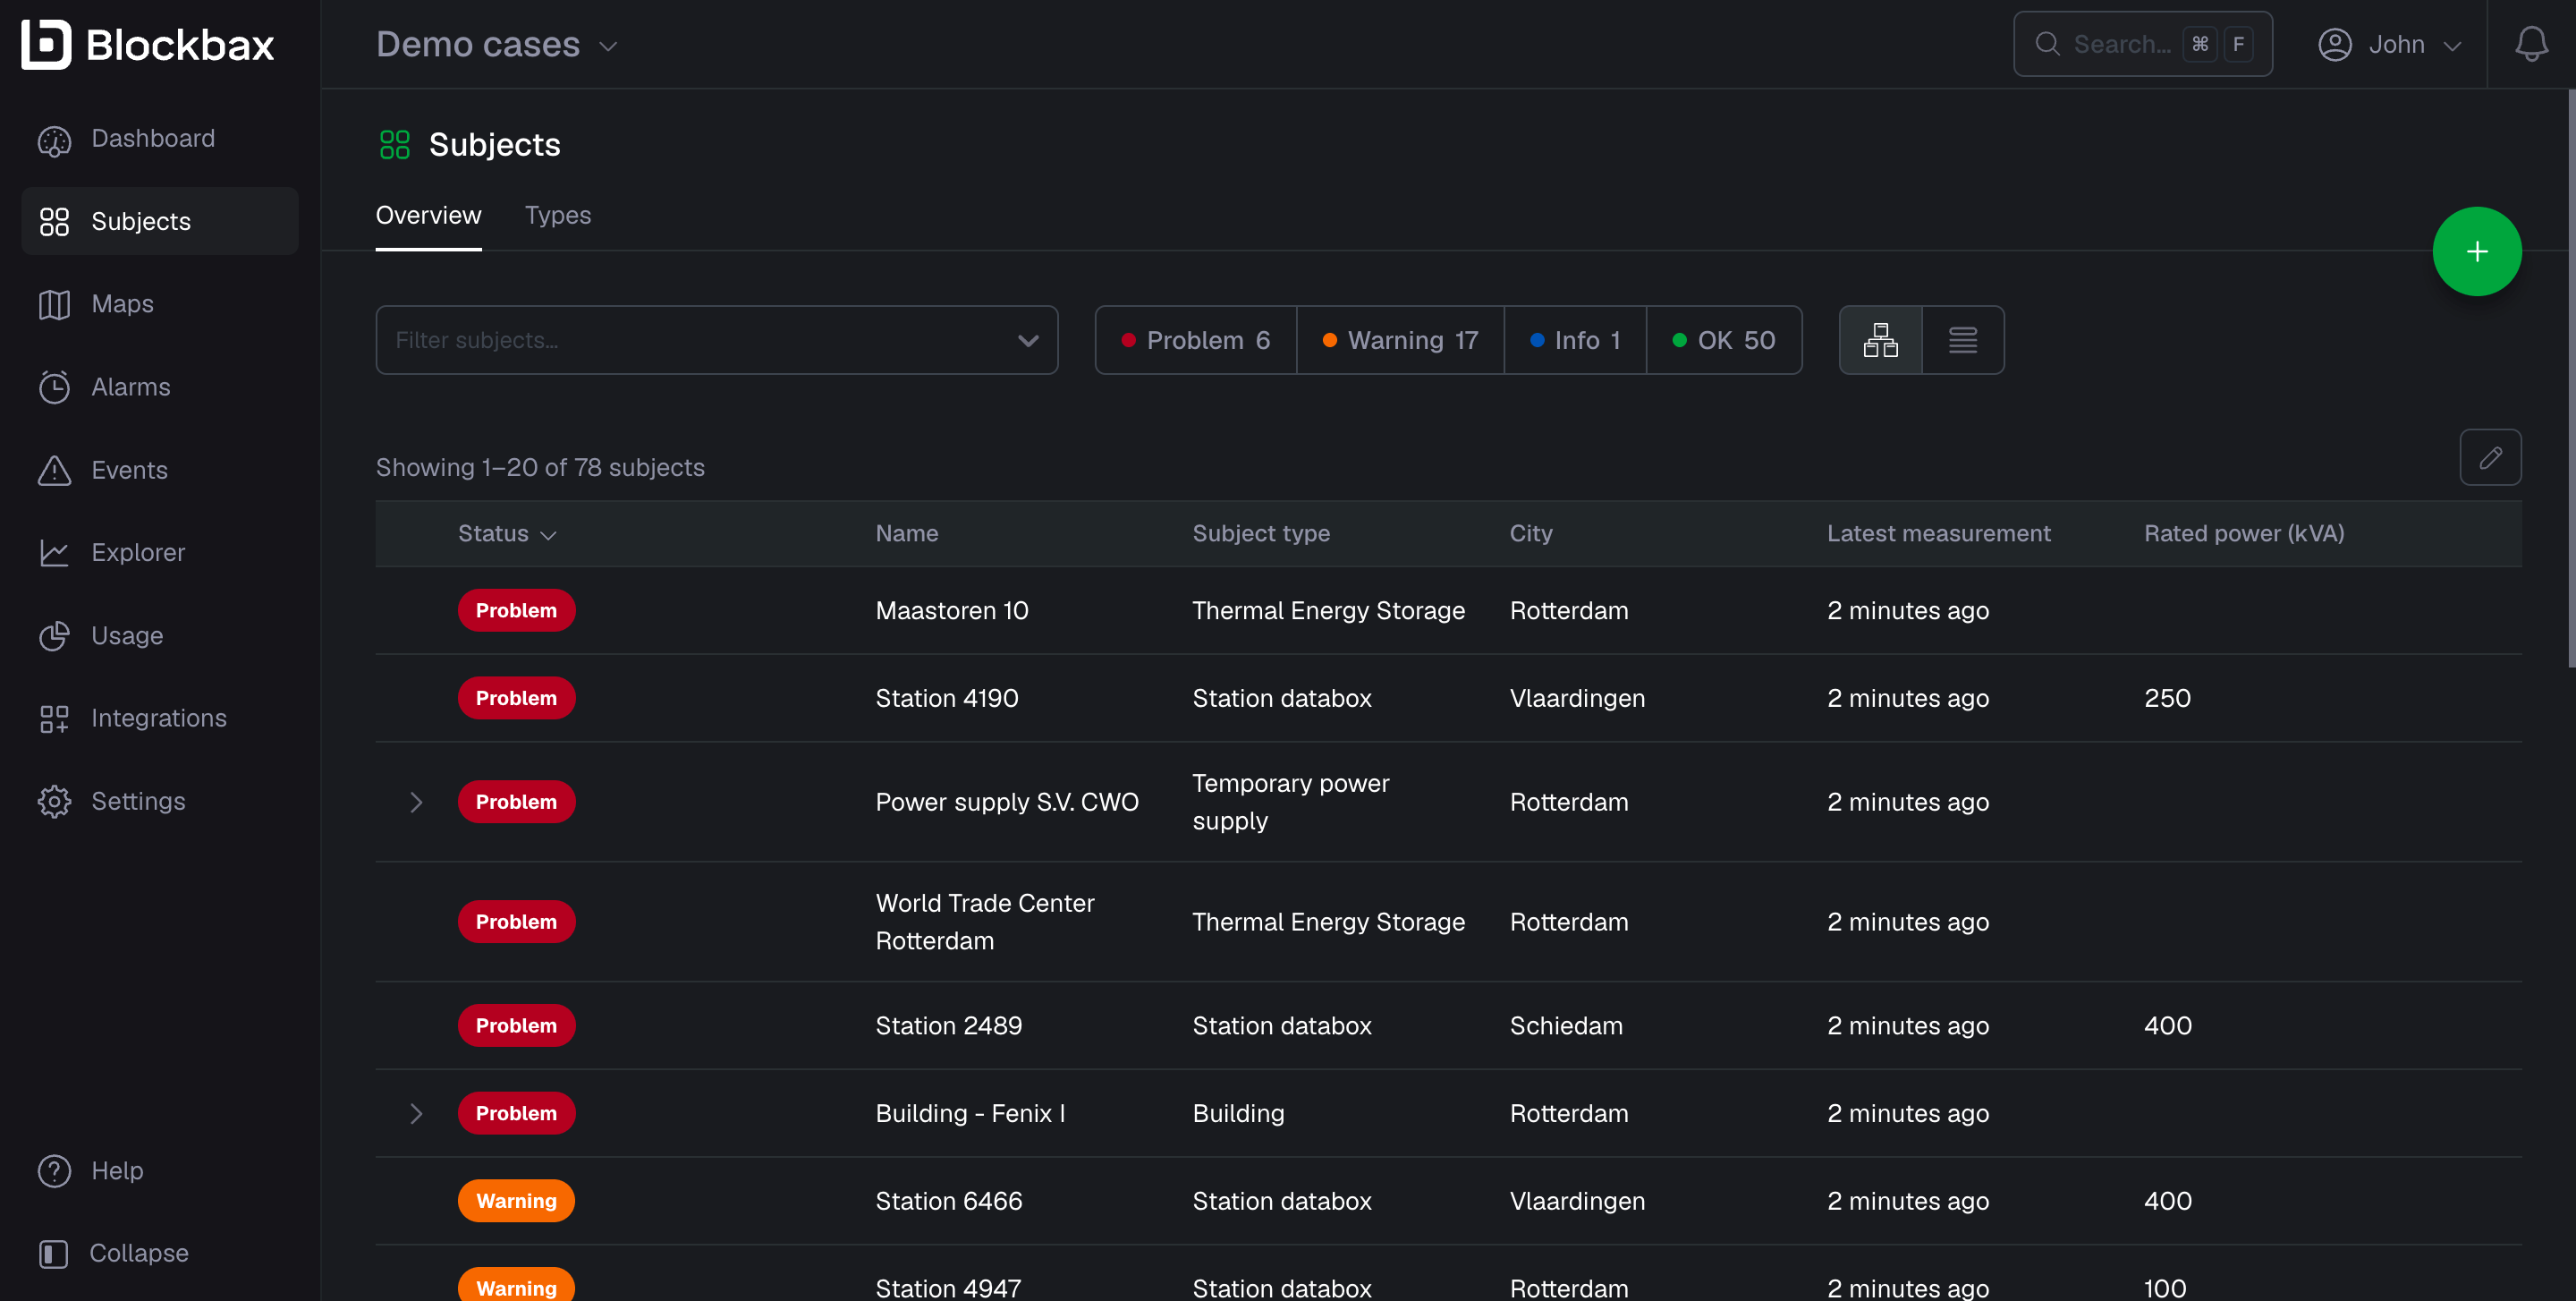
Subjects are the main assets you want to monitor. This can be a machine, office or a whole production line. For example, your bottle filling line and your packaging line can be a subject.
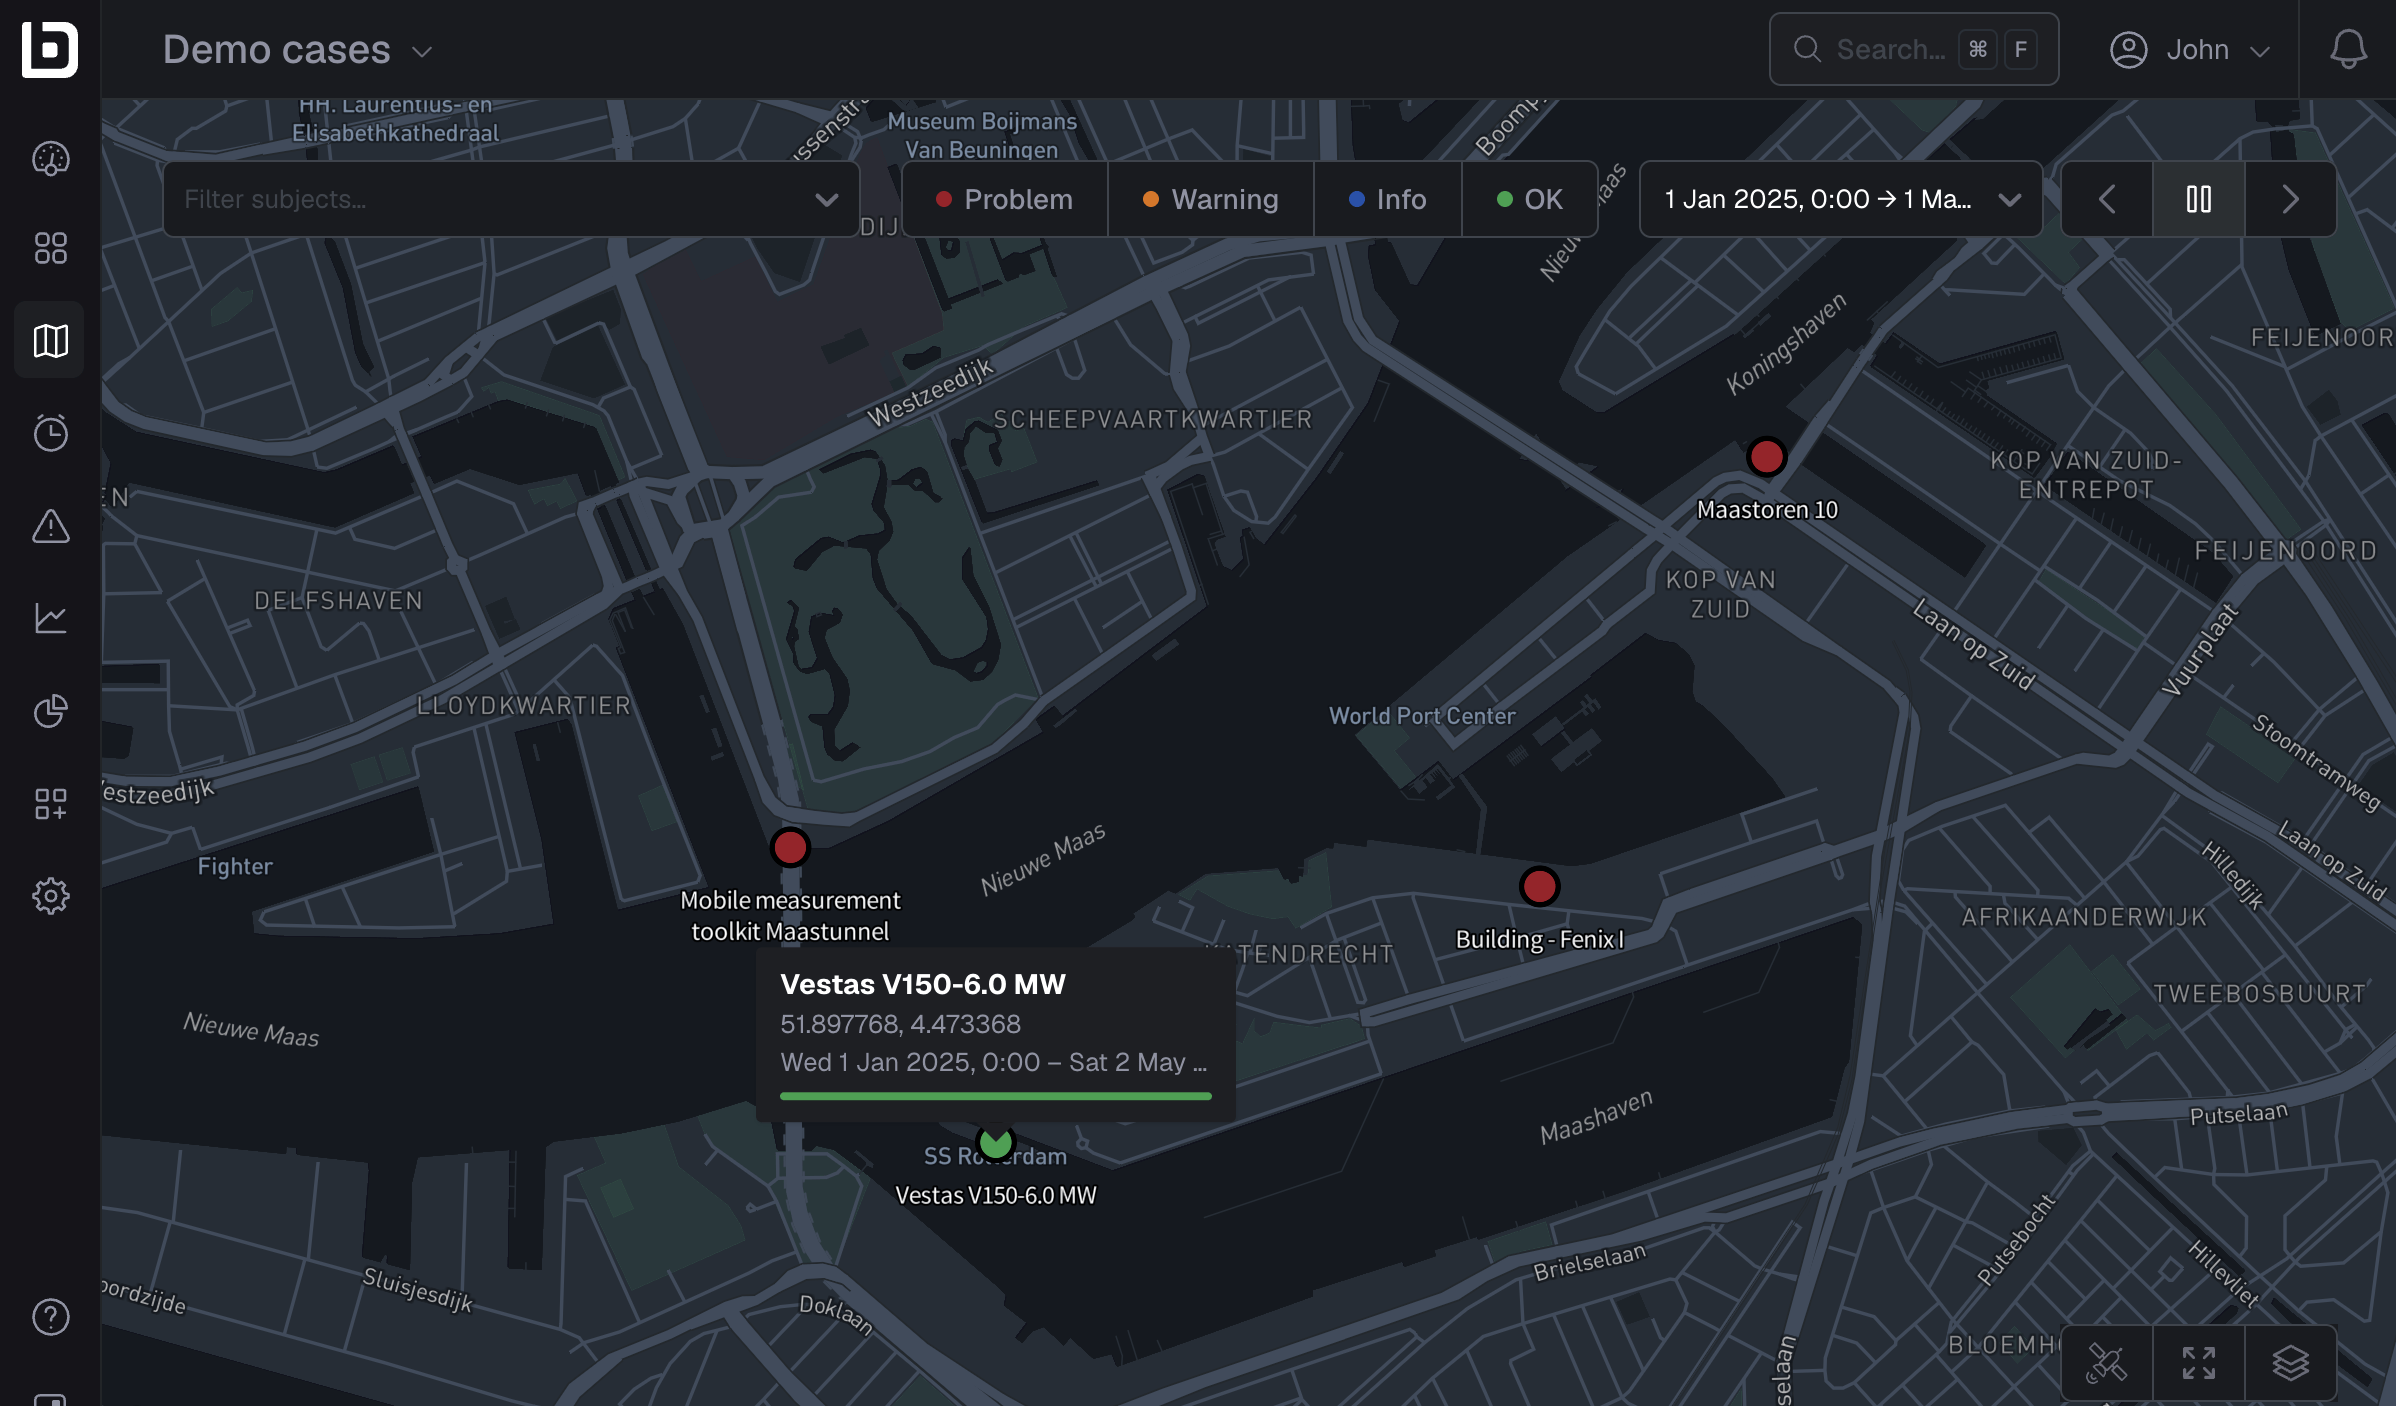
An overview of the subjects can be shown on a map
Here you see a subject dashboard inside a Blockbax project
For a more detailed overview of the functionalities, please see the subjects documentation.
Explorer
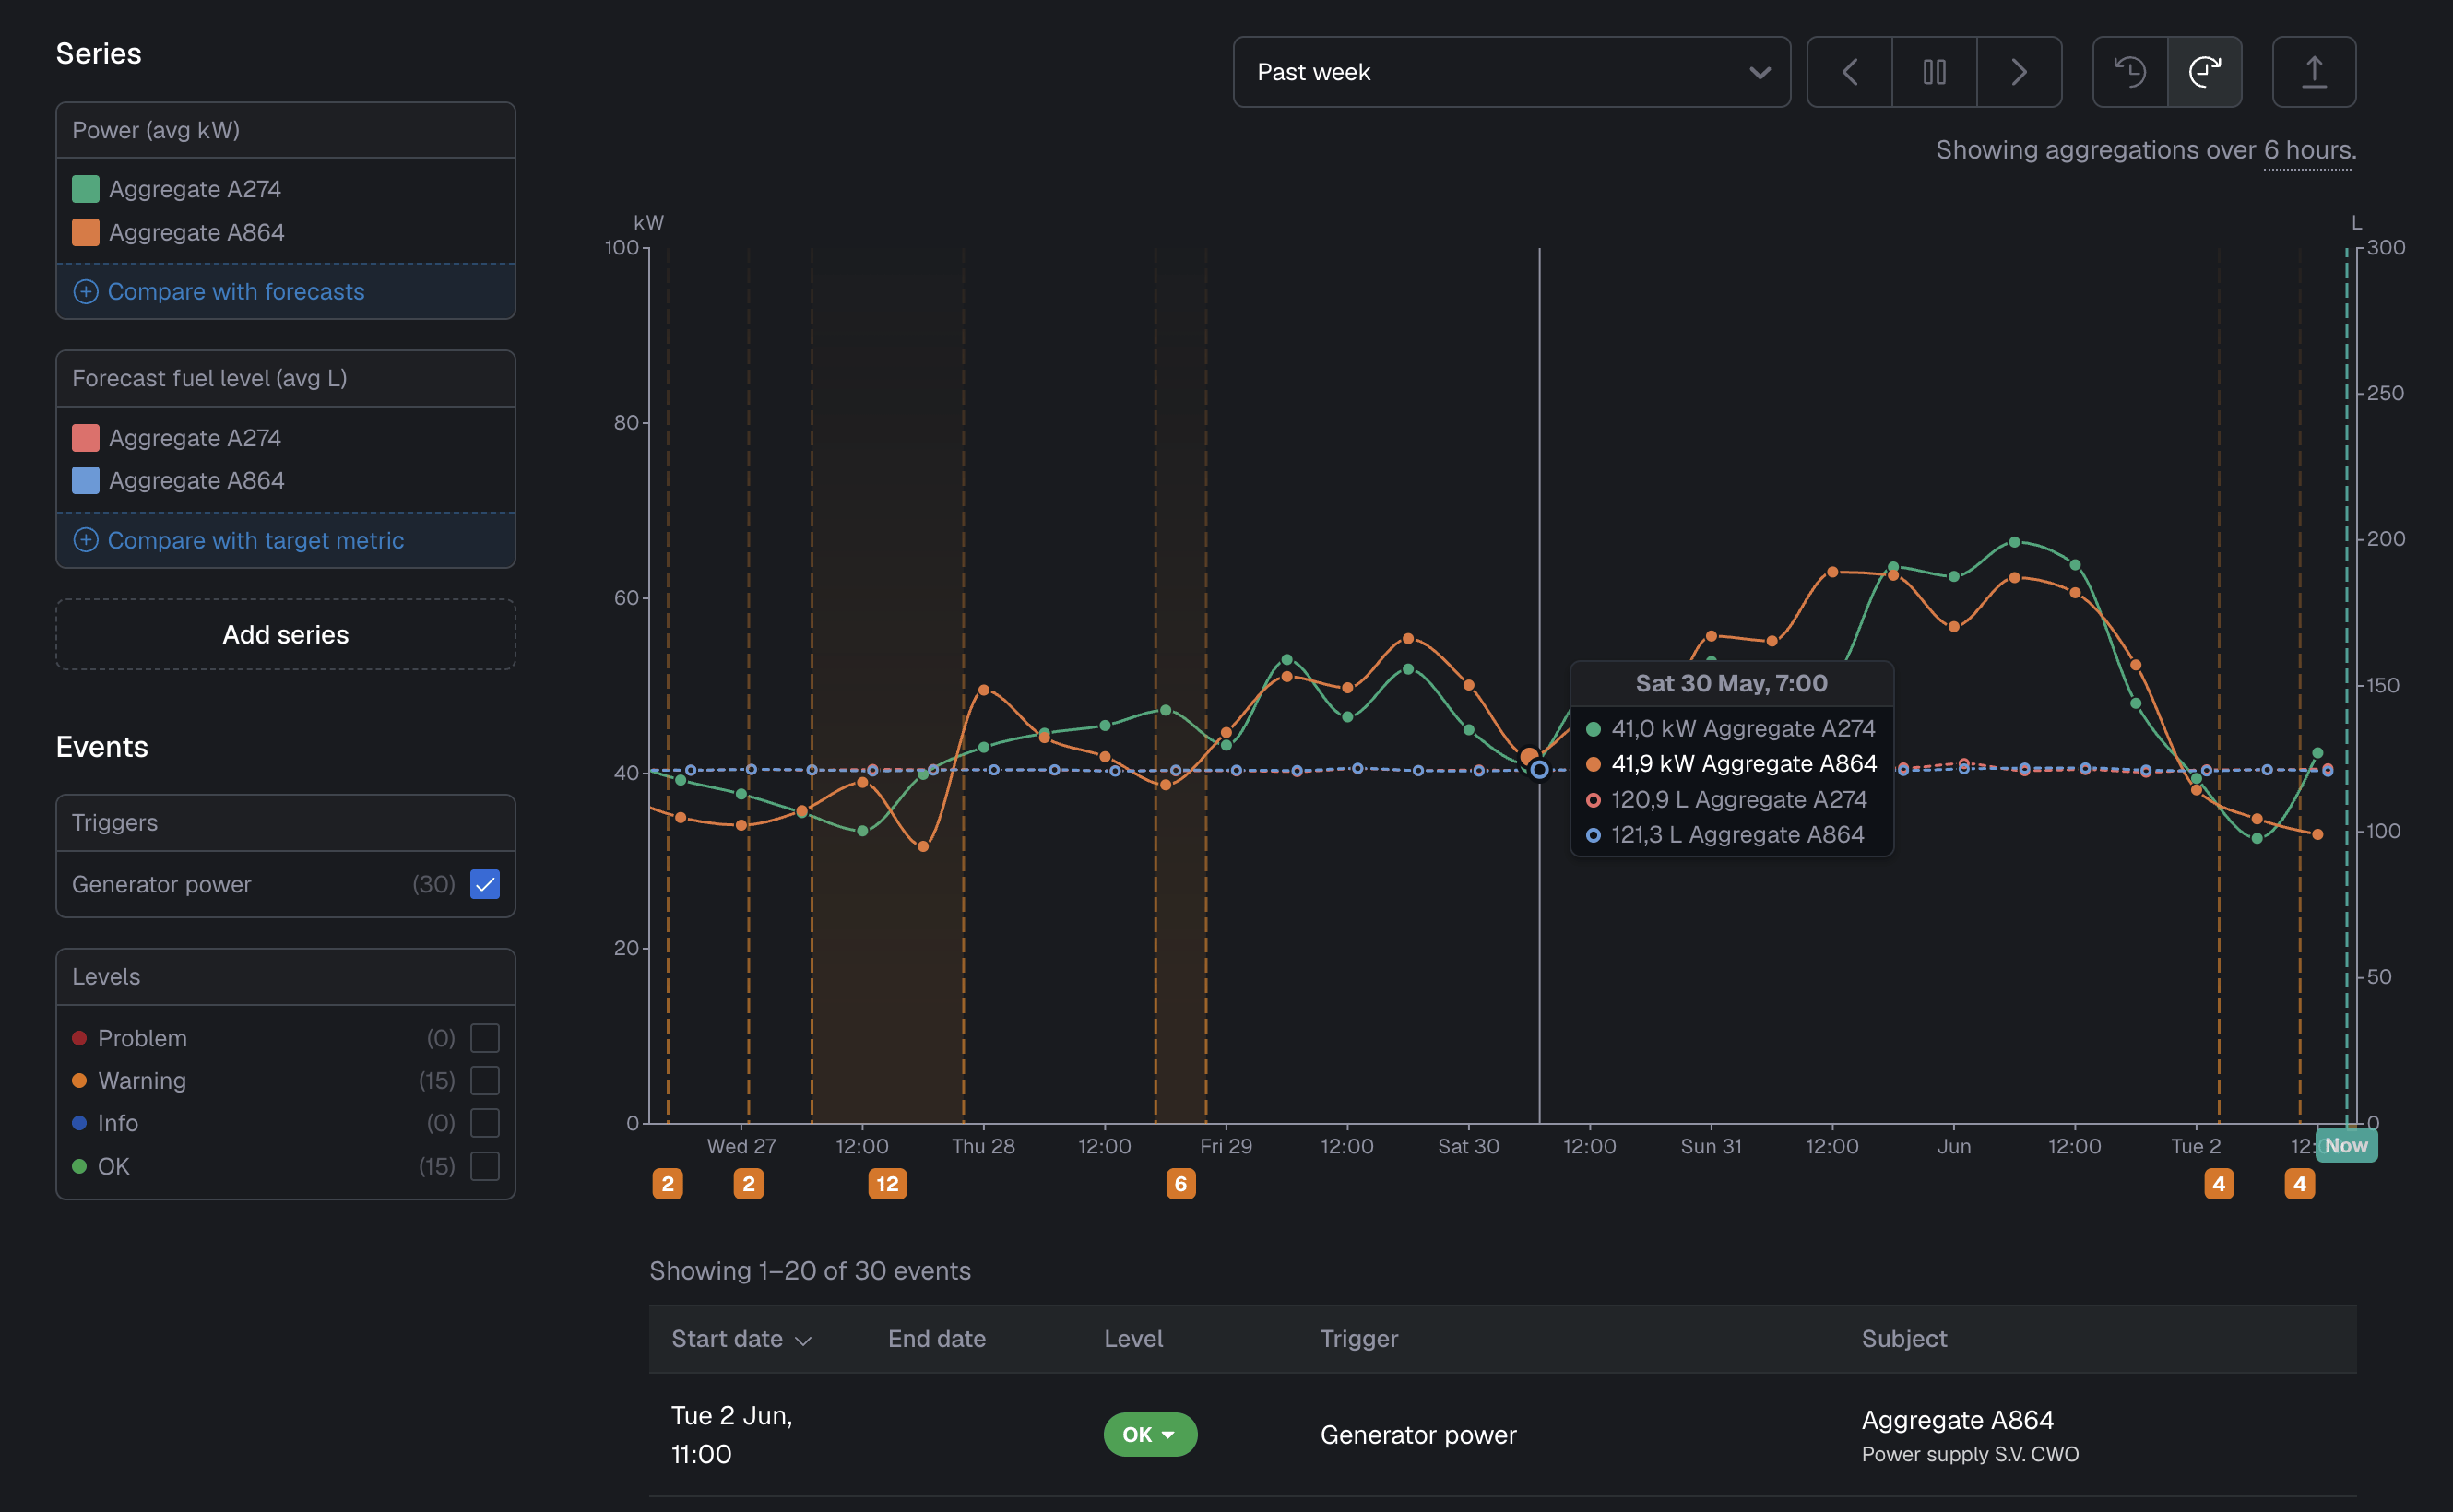
The explorer feature provides a user-friendly, powerful and rich way to view and compare measurements and events of different series. The combination of a subject and a metric is called a series.
For a more detailed overview of the functionalities, please see the explorer documentation.
Notifications
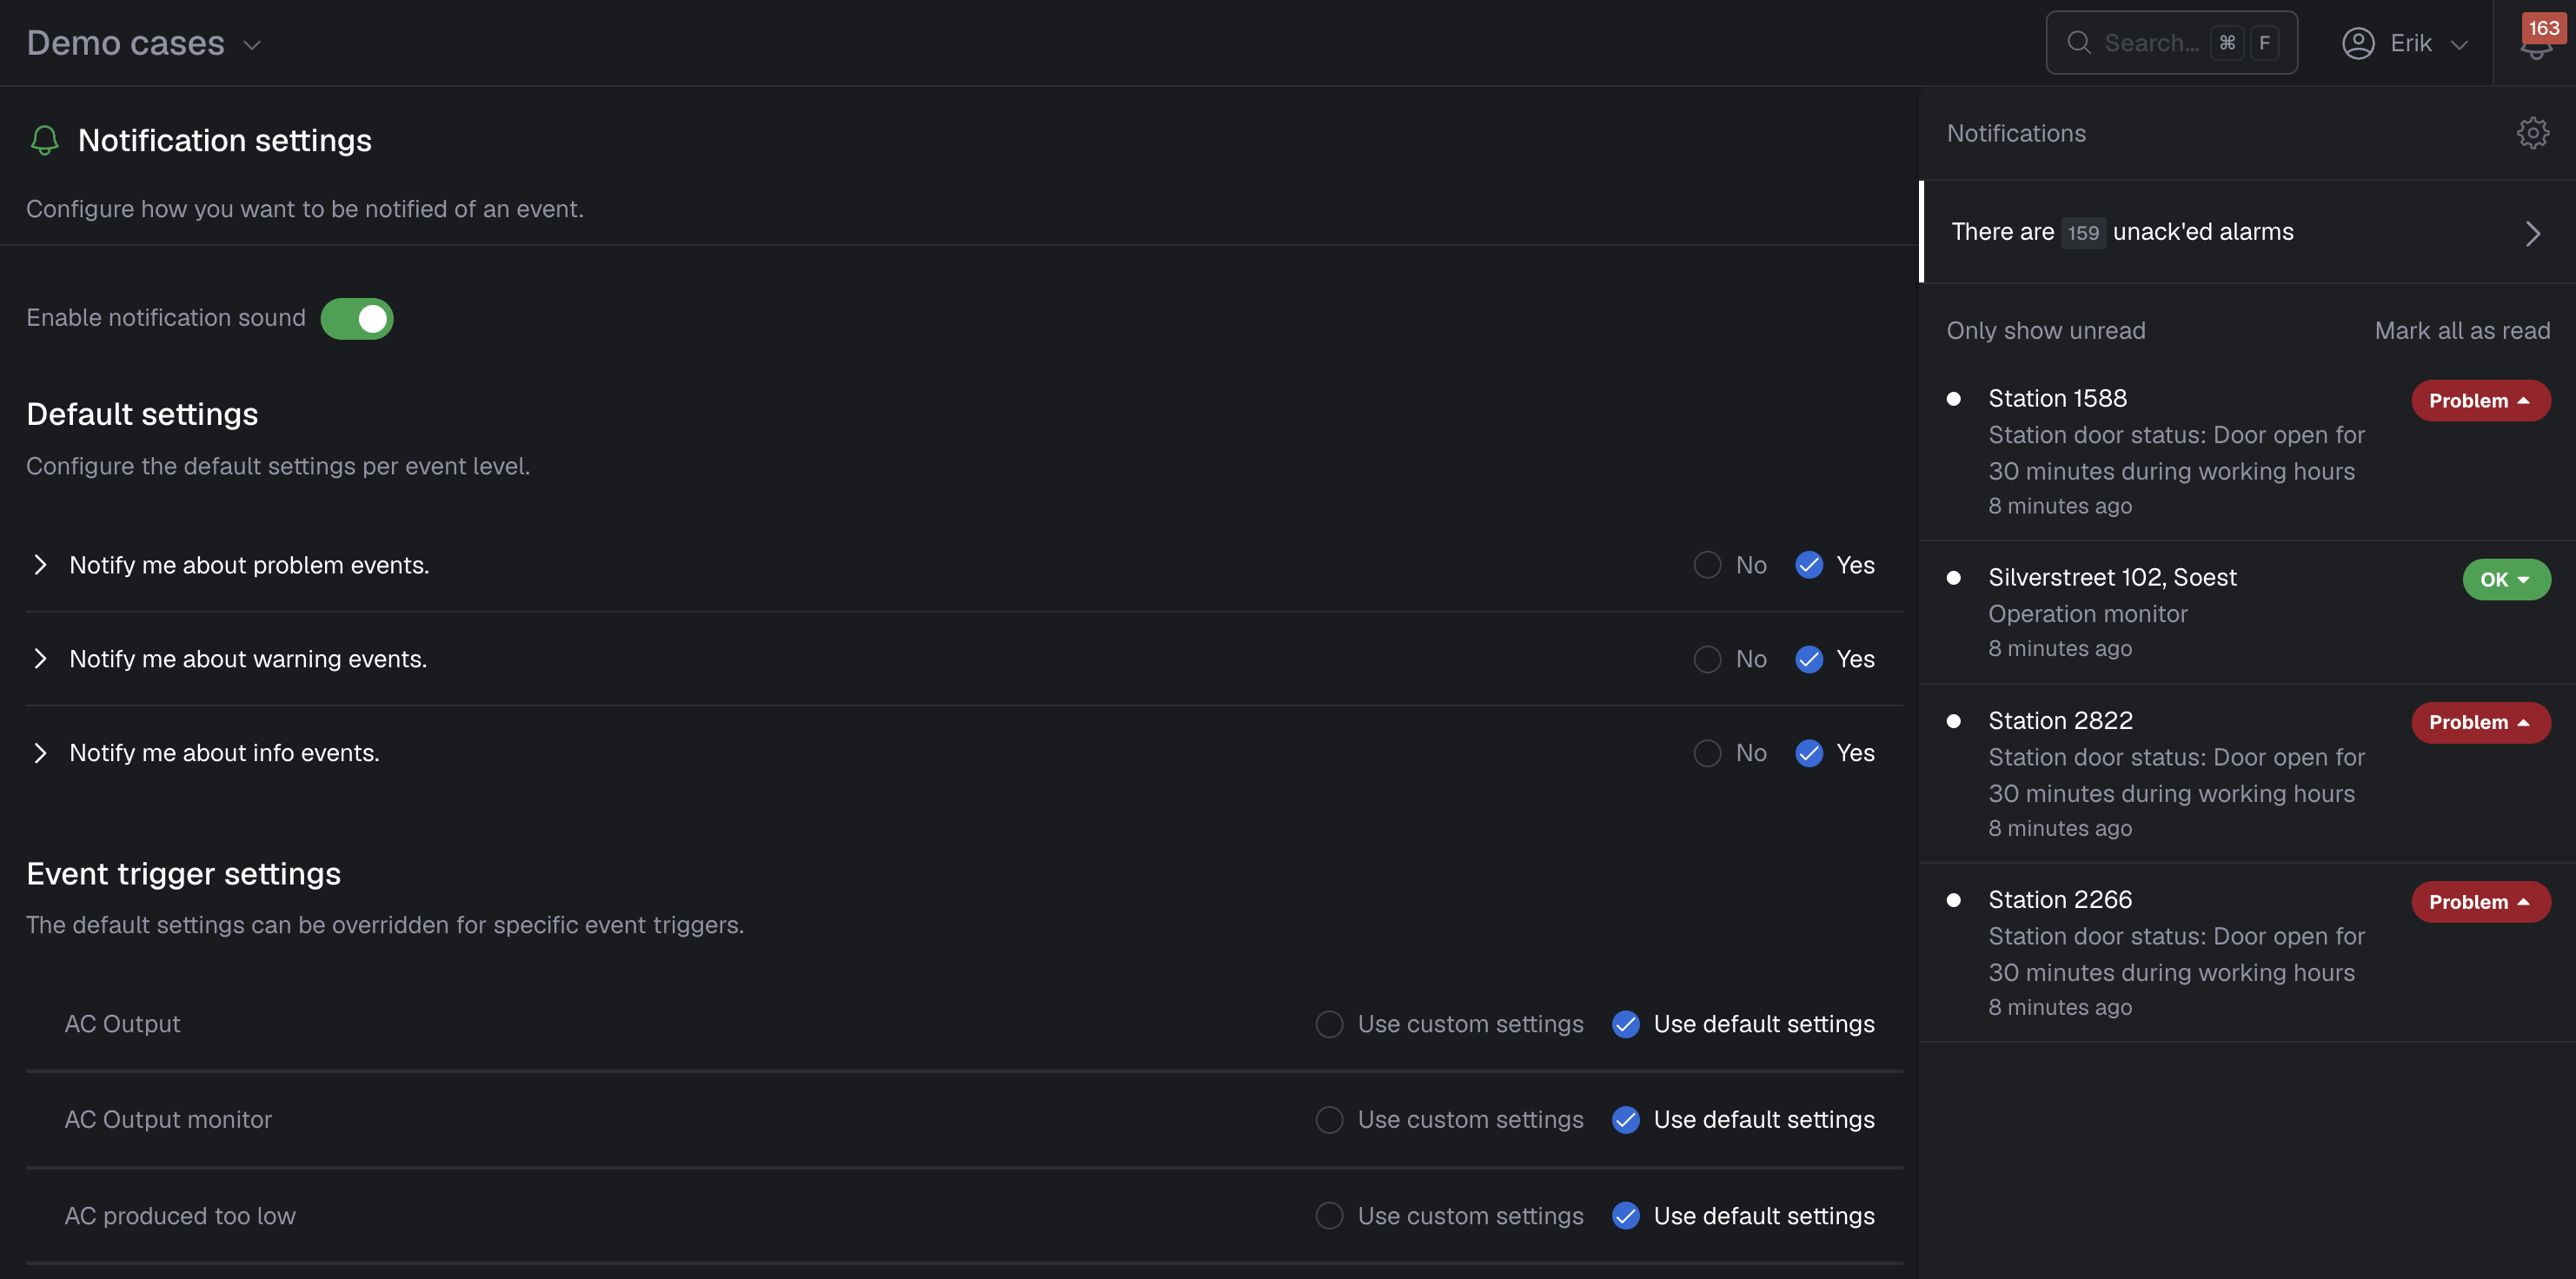
Turn on notifications so you do not miss the events you are interested in. Optionally, you can also receive notifications via e-mail and/or mobile push notifications.
For a more extensive explanation, please see the notification documentation.
Integrations
You can easily hook up your sensor data via MQTT, HTTP or CoAP. Your own applications can get data in and out of the platform by using our APIs. The platform also comes with webhooks where your applications can subscribe to instantly be informed once an event occurs.
More info can be found in the integration documentation.
How-to guides
Below you’ll find a list of topics that can help kickstart your Blockbax journey. These how-to guides will explain key concepts and help guide you through some good to know functionality in the Blockbax platform.
Understanding properties
- How to create a property
- Adding properties to subject types
- Populating a property
- How to set a primary location
- Adding an image to a dashboard