Docs
Explorer
The Explorer is a user-friendly and quick way to view and compare measurements and events of different subjects. This part of our web app provides a powerful and rich way to examine measurements and events.
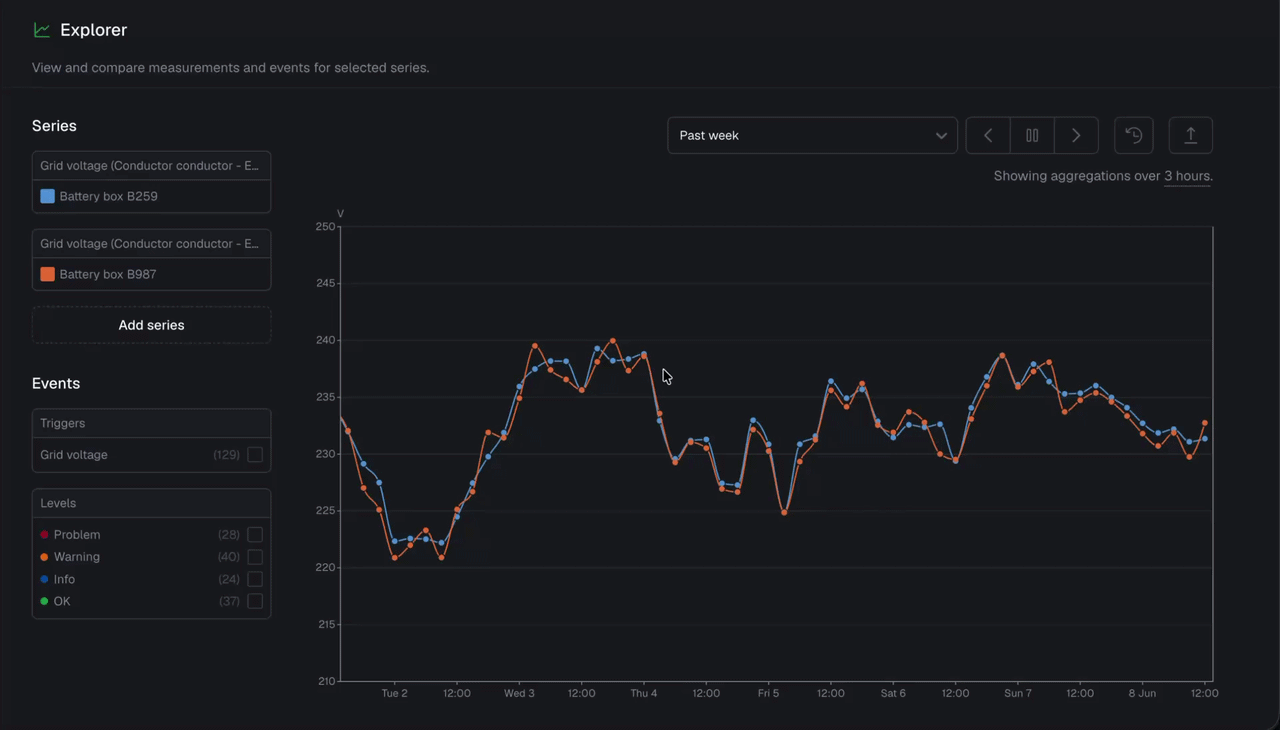
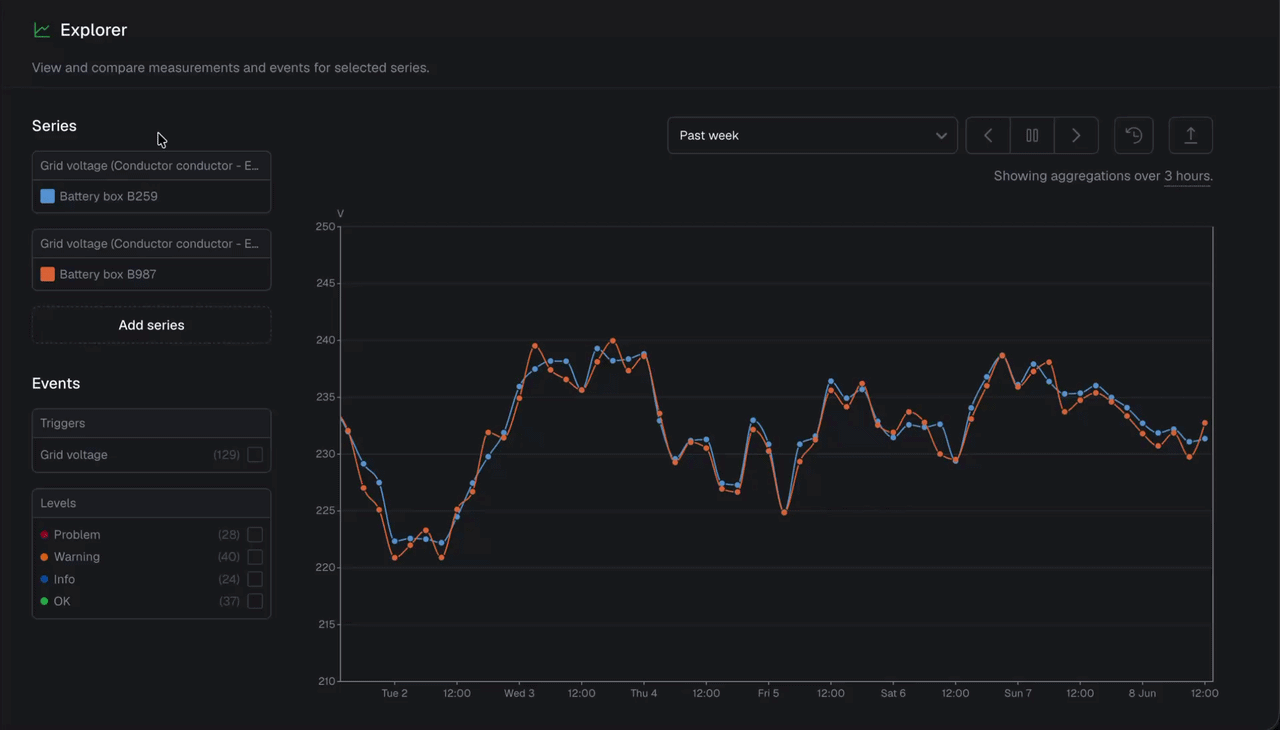
The combination of a subject and a metric is called a series (1). A series can also be an aggregated group of subjects and a metric.
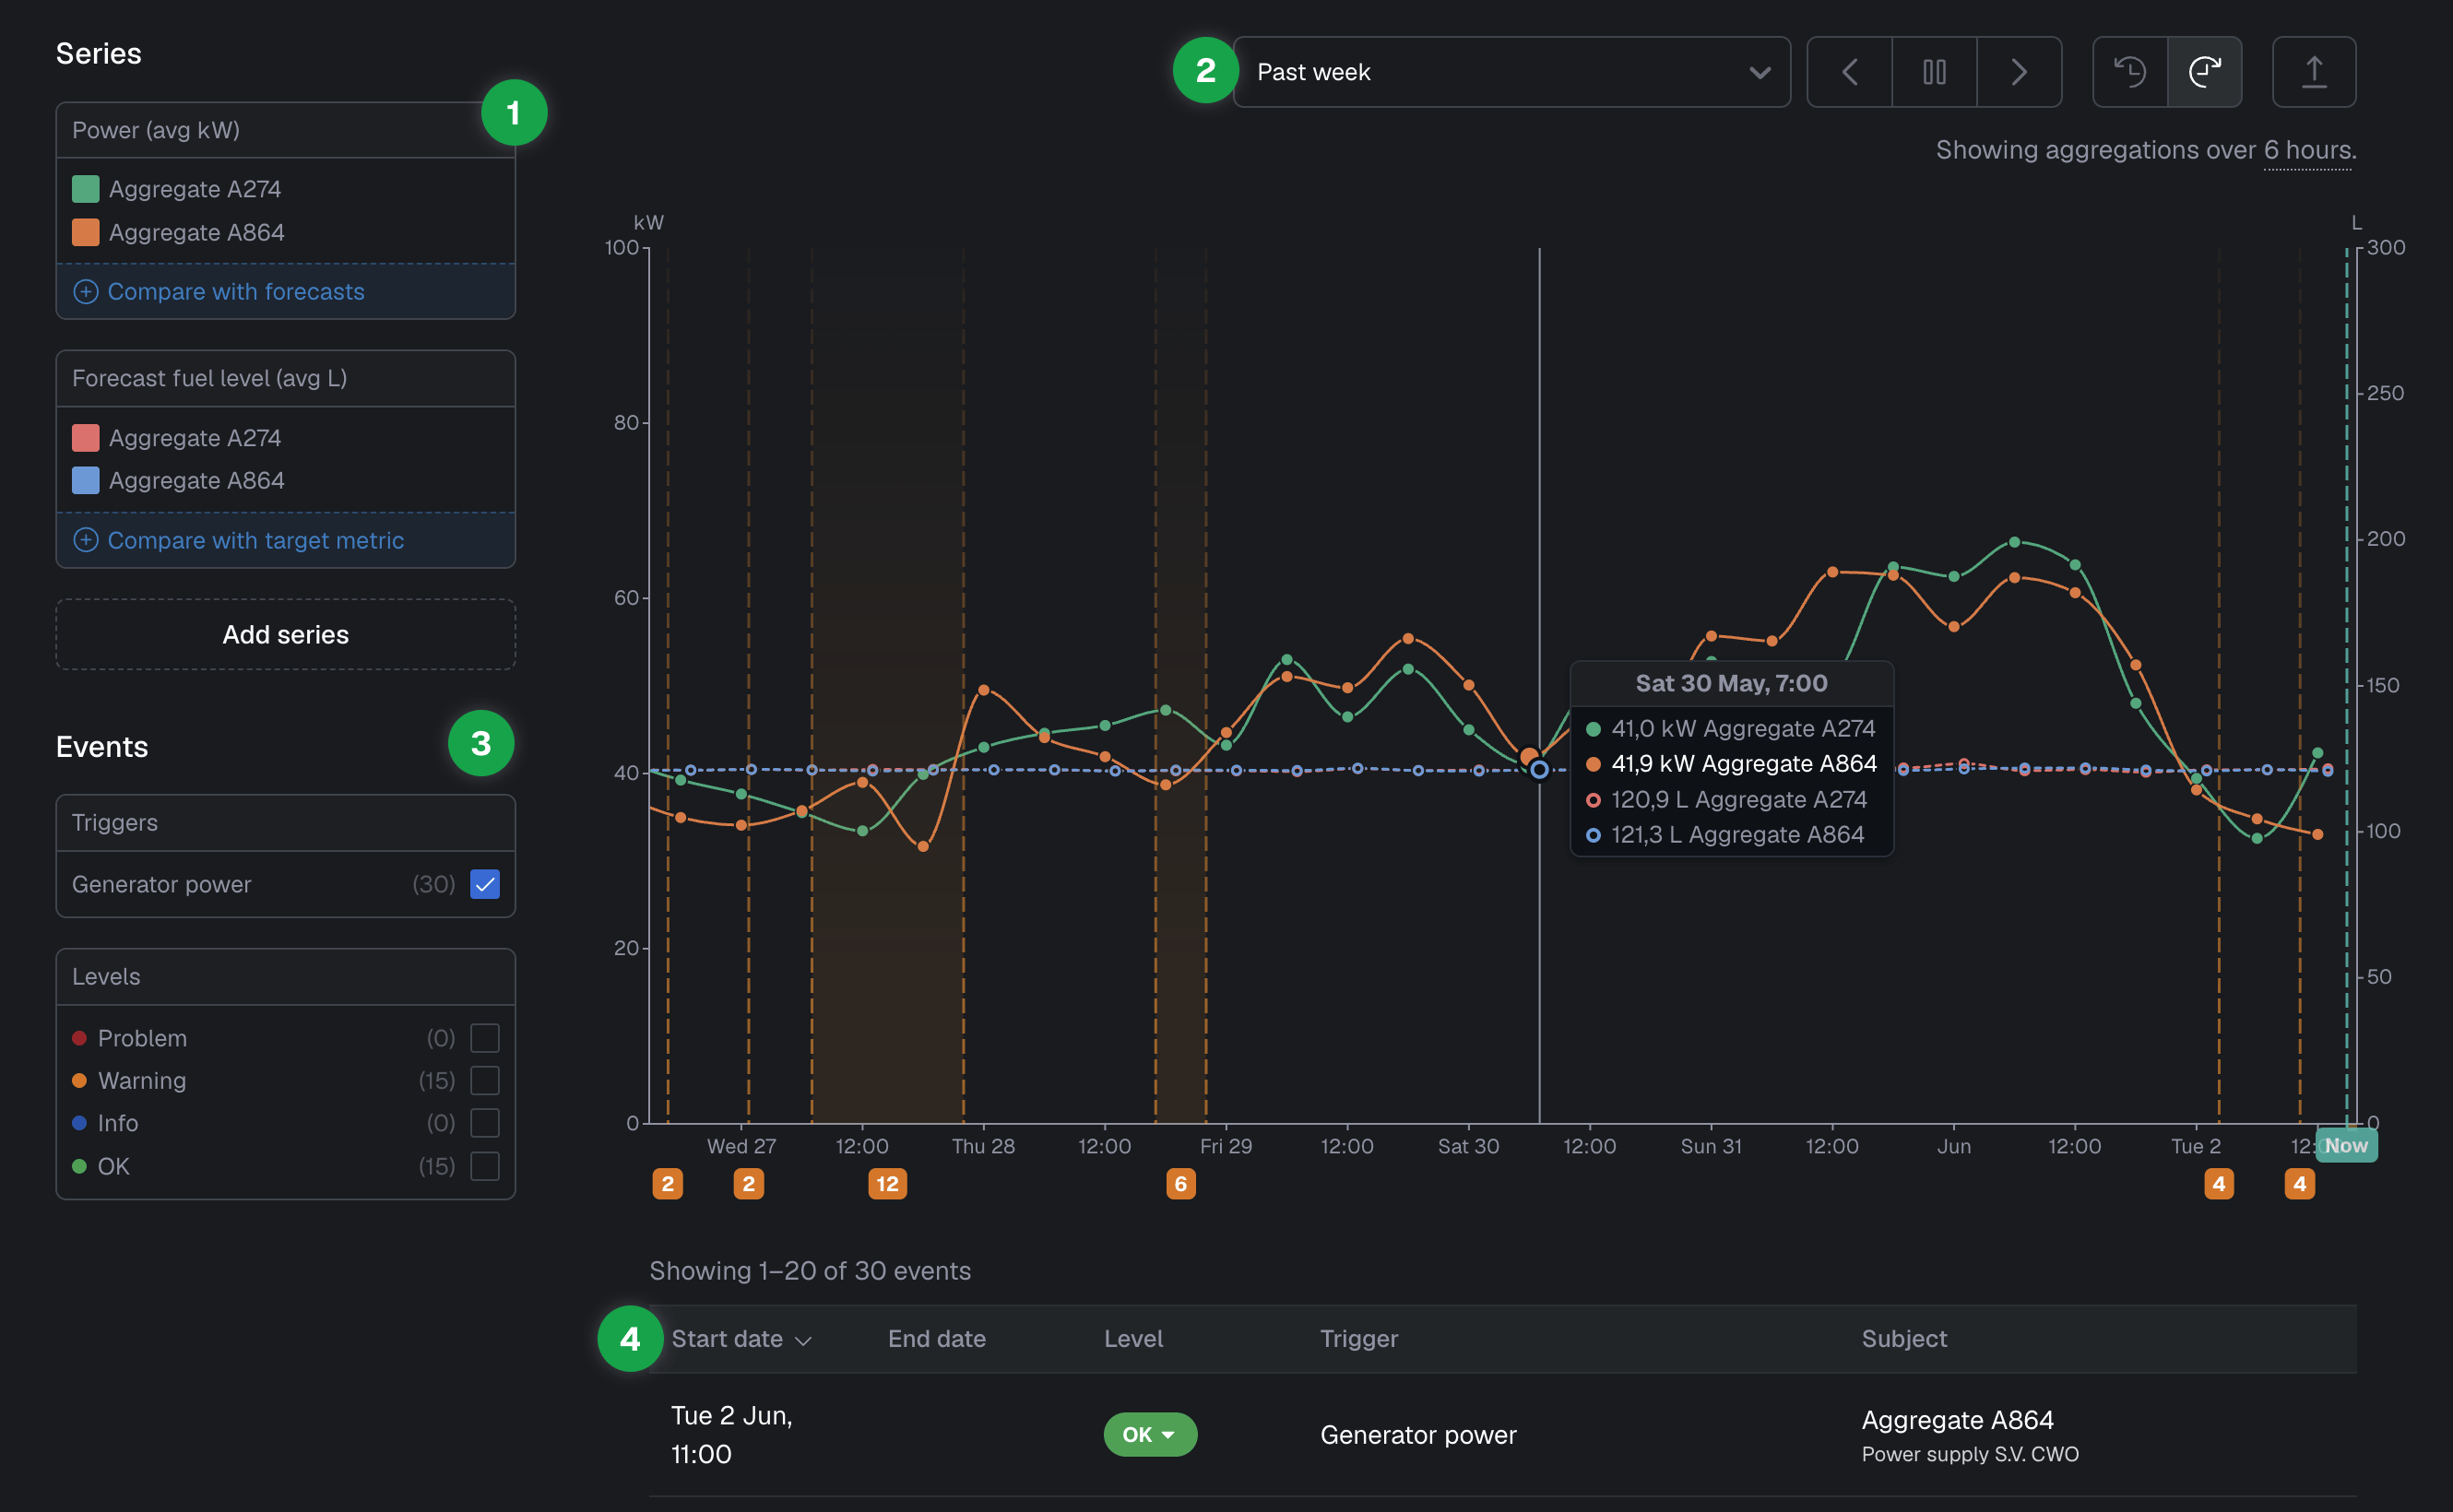
The data in the explorer can be filtered by a period (2). Be aware that the graph automatically refreshes as long as the pause button is not active. The arrows next to the pause button give the opportunity to easily jump between periods. The export button (top right corner of the screenshot) allows to export your graph to a dashboard, a PNG or get the data points of the graph as CSV. The back in time (next to export button) gives the option to compare measurements with previous period. You will see a dashed line of the same series which shows historic data of the period right before the selected period to easily compare data.
You can display events by triggers and levels based on the subjects and metrics you’ve selected (3). In this way you can easily investigate data that triggered the events and in-between brackets you see the counted number of events for that specific trigger or level. You will see the events in the graph and in a list underneath the graph (4).
Using the explorer
You can use the Explorer to compare data of different types of sensors and search for valuable patterns to act upon once you how to use this friendly and powerful feature.
Add and show series
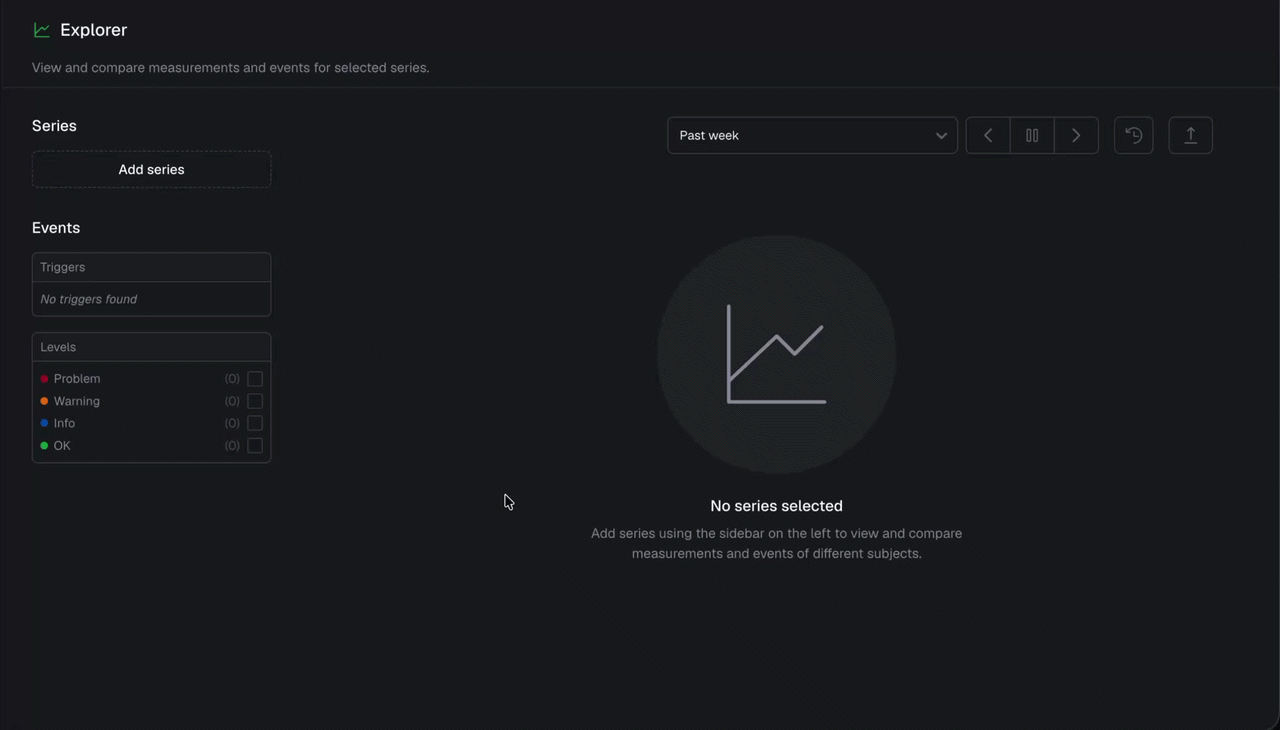
Using the explorer starts with adding series. You select a metric first and then have the option to narrow down the list of subjects by adding them one-by-one or by using a parent subject or property to select multiple subjects at once. Next, choose the “no aggregation” or one of the aggregation functions consisting of average, minimum, maximum, sum of values and number of measurements.
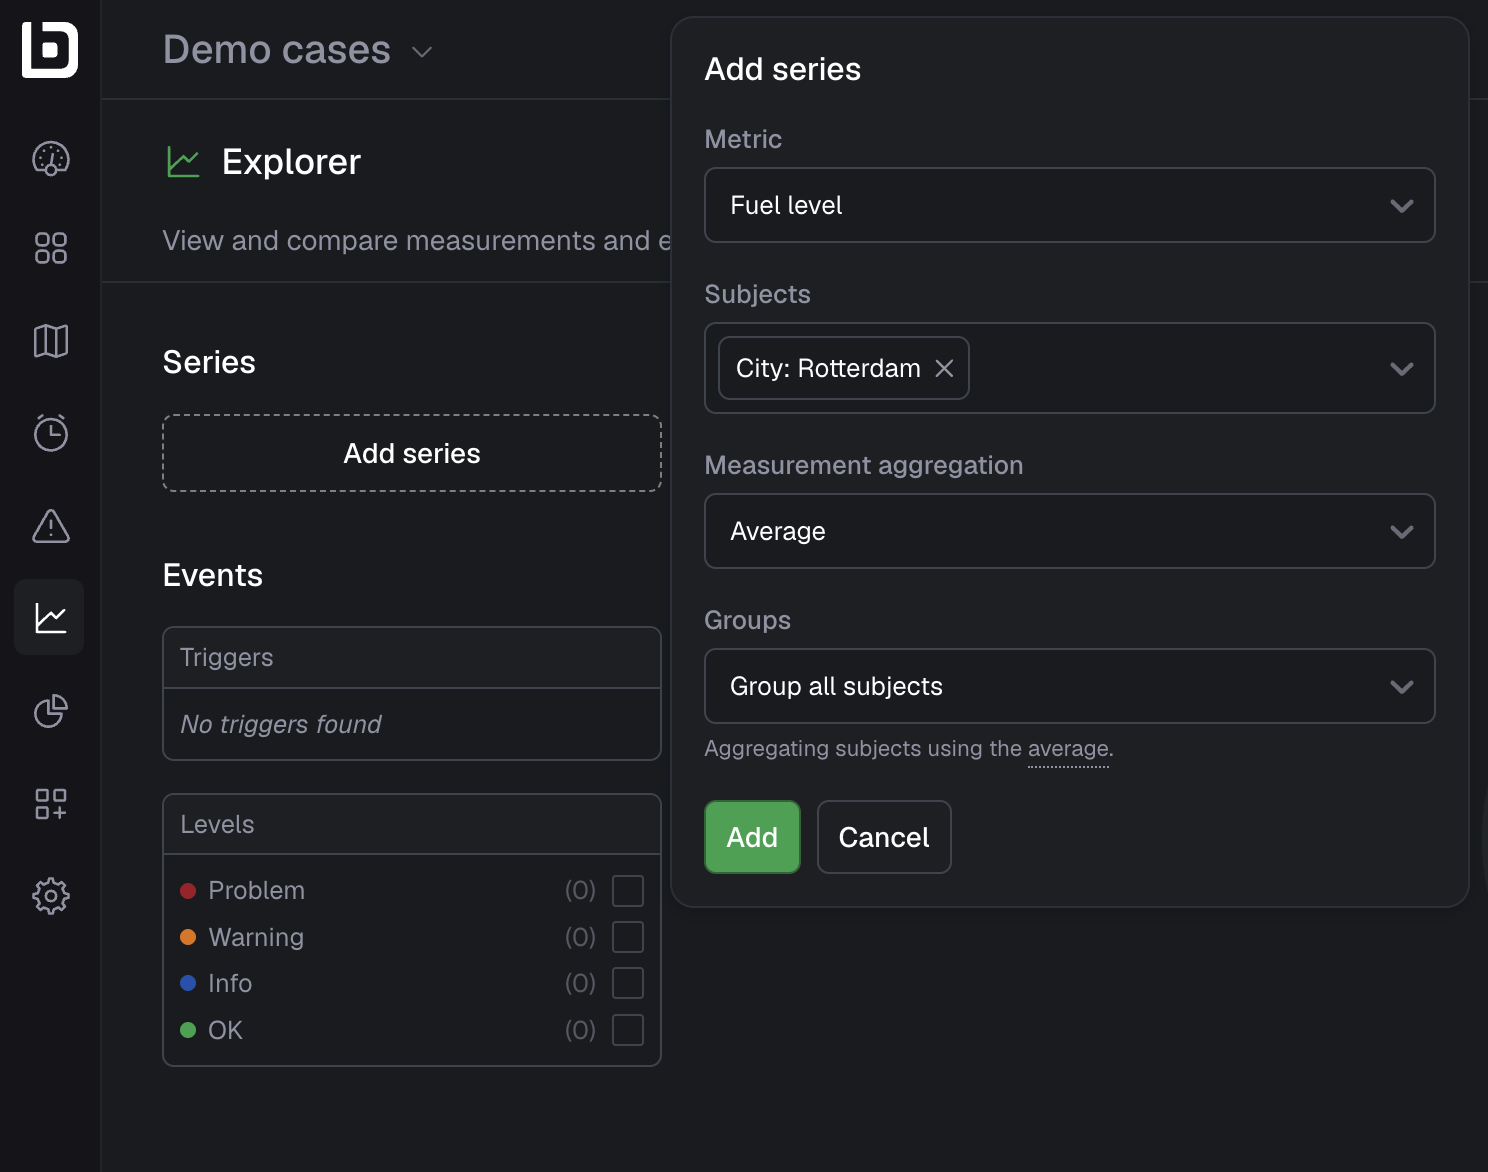
By default, all subjects will be shown individually, but you are also presented with the opportunity to group all subjects together or to split them up based on their parents or property values. This easy choice is a powerful to aggregate subjects together, for instance to compare the grid voltage of “Battery box B259” to that of “Battery box B987”. Here is an example:
Forecasted metrics
If you select a forecasted metric as part of a series, the explorer automatically switches to the forecasting mode. An indicator will appear on the chart showing where the current time is, meaning that any datapoints after this are forecasts for the future. Adding the target metric of your forecasted metric is as easy as clicking “Compare with target metric” at the bottom of your series. The reverse works as well when you have a series that uses a metric which forecasts are based on, in which case you simply select “Compare with forecasts” to add all the relevant forecasted metrics.
View events
You can show what events are triggered related to the subject and metrics you selected. Select the trigger and/or levels that you want to be shown as an overlay on top of your chart. In this way you can easily investigate data that triggered the events.
Zooming in on data
Here you can see a user refining the time-window by selecting a specific period with the mouse to zoom-in on an event. You can go back by double-clicking on the graph.