Docs
Scrollable table widget
February 27, 2025
You can now see what is next! We made the table widget scrollable which gives you the possibility to keep the widget small on the dashboard and scroll in the widget to see up to 100 rows. In the enlarged view of the widget, you can now even scroll or page through all the data. A typical use case is to show a top five of subjects, measurements or events at glance but still be able to see more if you scroll in the widget. Here are some examples:
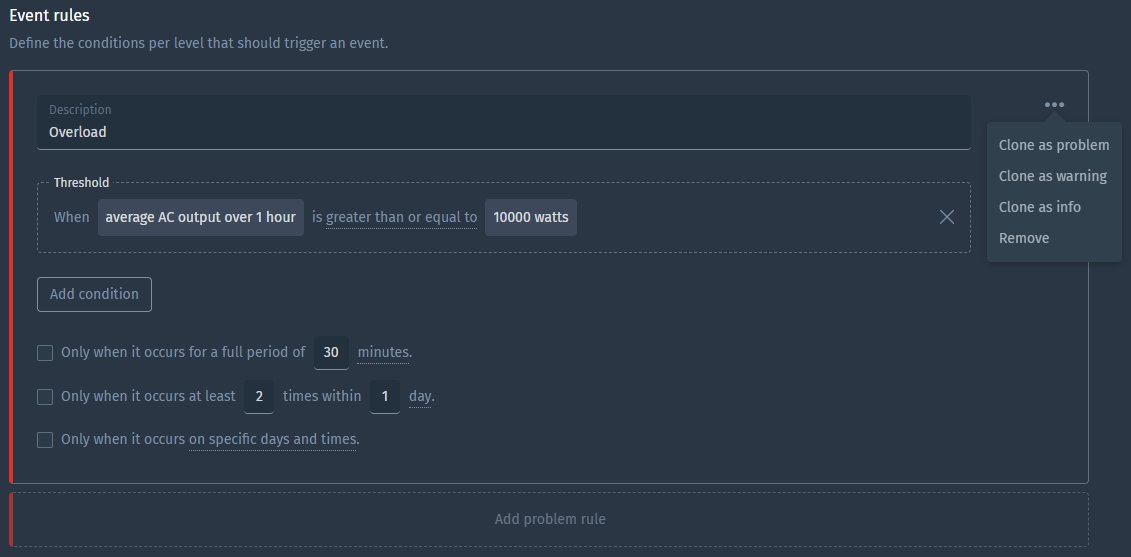
Clone event trigger condition
What we see often is the same trigger with different thresholds for another level, so we made it easy for you to clone a trigger.
Date functions in calculated metric
We’ve seen customer cases where triggering on a sum of production, consumption, fuel usage or any kind of metric per period is valuable. To enable this, we created date functions that simplify calculations per hour, day, week and month. These results can be used in triggers, graphs, tables and other visualizations.
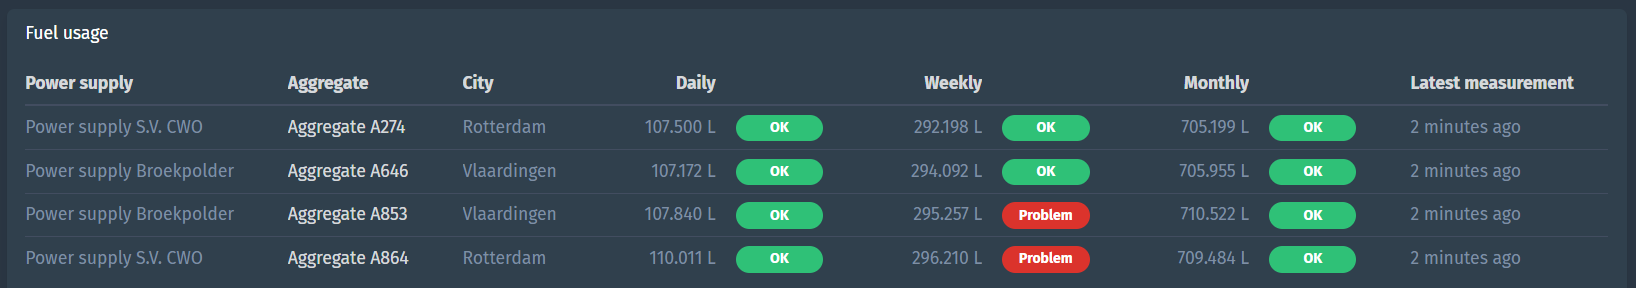
We added the example calculation for monthly fuel usage to the docs.
Improvements
- Support for LwM2M protocol
- Use property values to configure dashboard widgets
- Thresholds in line and bar chart dashboard widgets
- Generate audit logs for dashboard changes
- Explicitly save dashboard after editing
- Filter out empty text measurements when using measurement filtering
- Make initial position in stream configurable when consuming from Azure Event Hub, Kafka or Amazon Kinesis in inbound connectors
- Support to upload a pem file without a password when using a custom config for trusted TLS/SSL certificate authorities in MQTT and Kafka inbound connectors
- Add support for custom Mapbox style URLs (experimental)
Fixes
- Fix lag when editing large dashboards
- Fix copy+paste between rich text dashboard widgets
- Limit selectable parent subject types only to applicable in Table widget’s subject overview data source
- Limit subject status to only event triggers you may view
- Prevent “enter” from closing dialogs
- Fix “floating” period toggle buttons
- Fix payload with array with
nullvalue not handled correctly - Fix scatter plot unexpected errors
- Fix subject labels when embedding charts
- Fix gauge chart threshold validation
- Speed up loading event triggers