


Docs
On-the-fly calculations
August 4, 2026
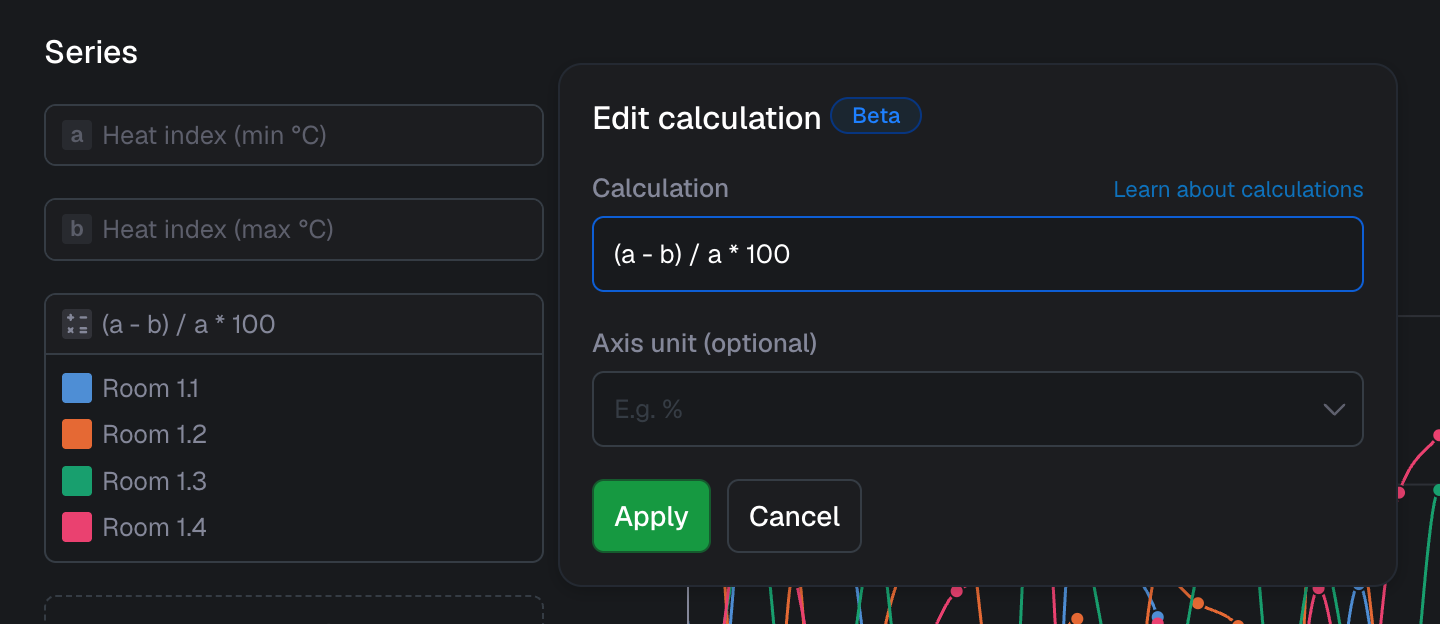
Until now, series in the explorer and in line/bar chart widgets as well as the single value and gauge chart widgets could only show measurements directly, optionally aggregated across subjects. With this feature, currently in beta, you can now combine and transform those series using the same calculation language that powers calculated metrics.
In the explorer, adding a series now gives you the choice between a measurement series and a calculation series. Once you’ve added at least one measurement series, you can reference it by its letter (a, b, c, …) in a calculation to derive a new series from it. The same capability is available in the single value, gauge chart, and line and bar chart widgets that display measurements, so you can show calculated results directly on a dashboard without first creating a dedicated calculated metric (and thus without the costs of extra usage for series or measurements).
A common use case is tracking KPIs on the fly, such as an efficiency ratio (e.g. heat output divided by electricity consumption), a load factor (e.g. average load divided by peak load), or a loss indicator (e.g. the difference between inflow and outflow measurements).
Improvements
- Users who are logged in with SSO can now also log out of the app.
- We increased the maximum length of event rule descriptions to 200 characters.
- We now warn you when you’re a member of a project that requires MFA but you haven’t configured it on your account.
- Changes to custom widget code are now saved automatically, so you no longer need to click an update button.
- We added a new color palette to the map widget that renders values on a green-to-orange-to-red scale.
- Logged-in sessions now show the latest IP, OS, and client information.
- Improved performance when fetching changes in large projects.
Fixes
- Fixed an error when sorting alarms by subject name.
- Conditional widgets no longer unexpectedly change position.
- Fixed a performance issue on dashboards that was most noticeable in Firefox.
- The mobile app no longer gets stuck on a loading screen after the session is logged out.
- Fixed an incorrect value on the y-axis of line/bar charts when it only shows one label.
- Dropdowns no longer cause unnecessary scrollbars or get positioned over the control.
- Dashboards now show a clear error message when they’re too large to save.
- System messages like the timezone warning no longer trigger a scrollbar.