Docs
Extended aggregation options
April 24, 2025
From day one it has been possible to show measurements for individual subjects or aggregated over all subjects. Now it is also possible to aggregate measurements grouped by parent or property. The feature is available in bar and line charts as well as in the Explorer:
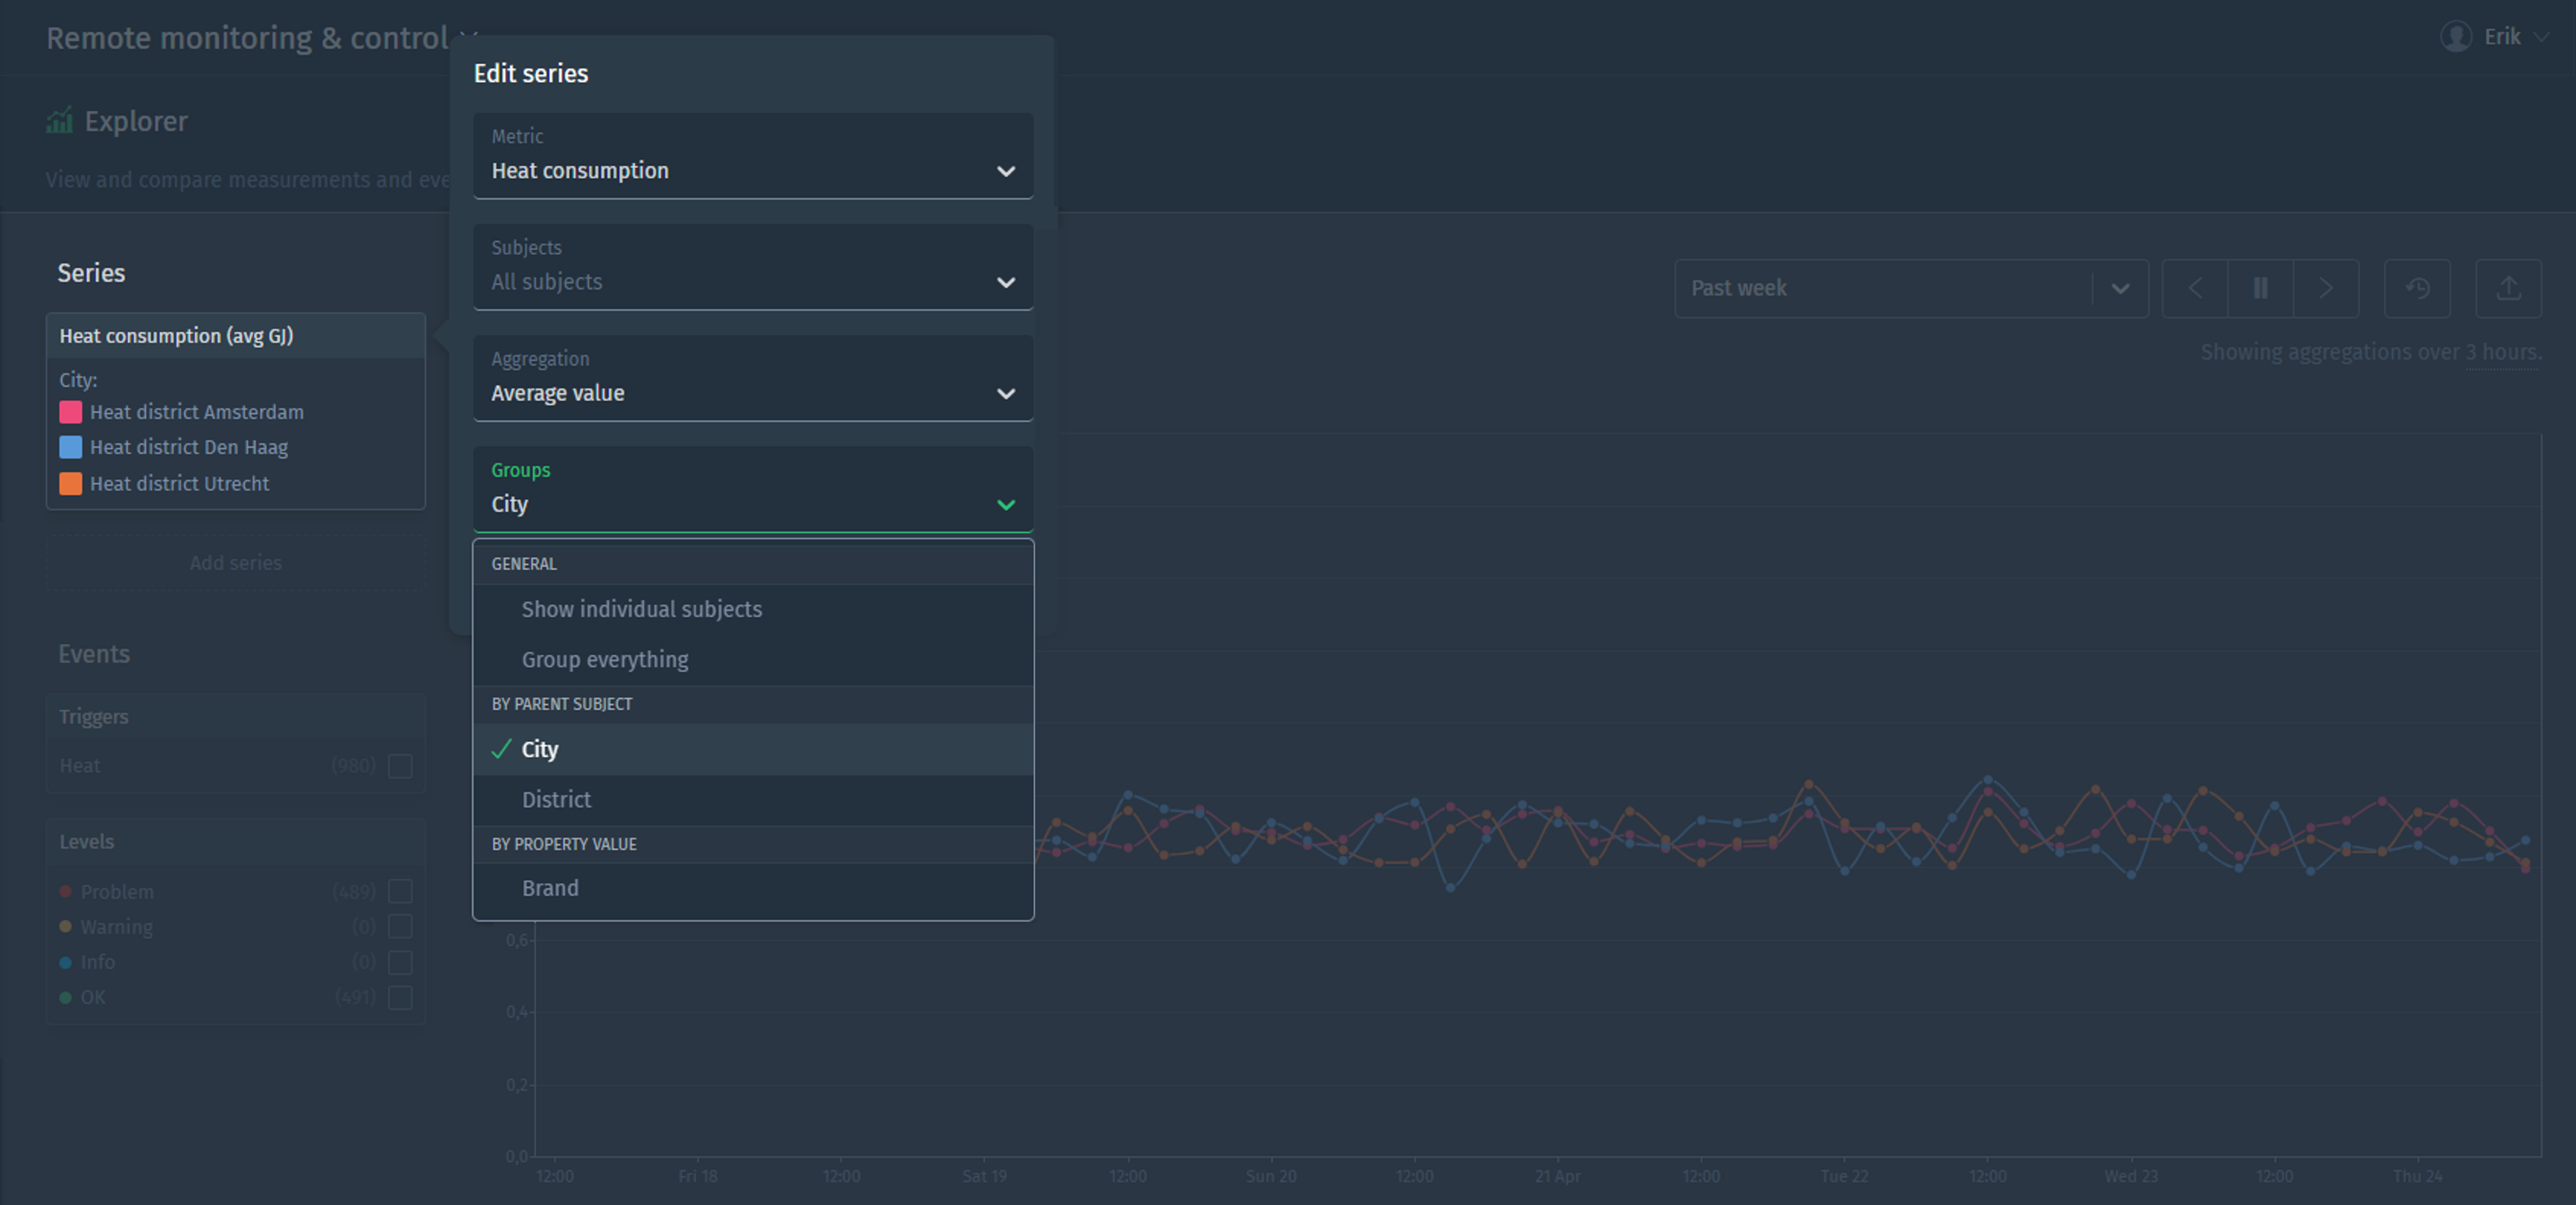
Useful examples include maximum values of energy meters by brand (group by property value) or showing the average temperature for production units grouped by the heat network they are in (group by parent subject).
Improvements
- New options to filter alarms based on priority, active and created date
- Show validation message when inbound connector test payload is too large
- Allow hiding points in embedded line charts
Fixes
- Fix the issue that the repeater was not reset when discarding dashboard changes