Docs
Aggregations in table widget
March 27, 2025
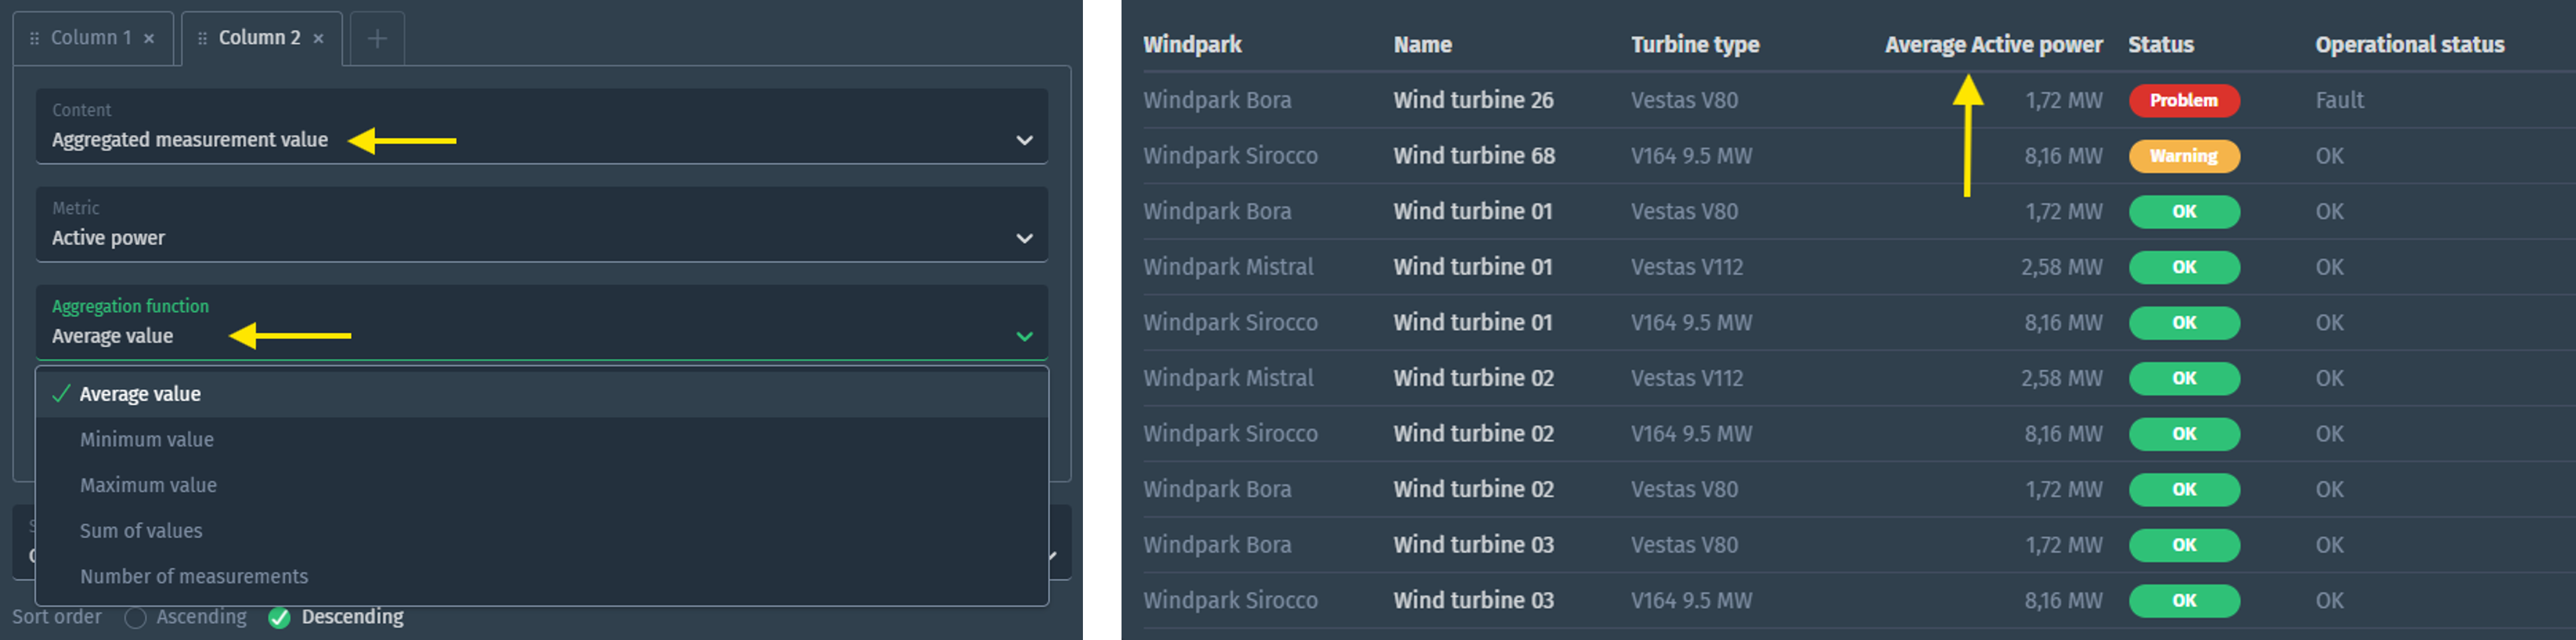
We’ve been enhancing the subject overview ever since we introduced the table widget. Now, we’re excited to announce the release of aggregations! With this powerful extension, you can effortlessly display average, minimum, maximum, sum of values, and number of measurements over any selected period on your dashboard. This is, for instance, excellent for showing your average power over one hour or the maximum power of last month. Furthermore, this allows you to aggregate over child subject measurements. For example, you can use this to show the average power generated for all turbines per section in your wind farm.
Support for LwM2M
The platform now supports Lightweight Machine-to-Machine (LwM2M) protocol, including a powerful ability to issue commands using actions. If the device is offline, commands are automatically queued until it is reconnected. This opens up a world of new opportunities for integrating resource-constrained devices. Imagine devices that need to be efficient in bi-directional communication because they run on batteries and need simplified messaging due to low bandwidth, especially when operating in remote areas. Ready to explore more? Check out our LwM2m documentation for all the details!
Improvements
- Add group-by functionality to explorer
- Allow hidden property selection in all widgets
- Up character limit for webhook URL to 2000 characters
- Prevent autofill of username and password by password manager in inbound connector
Fixes
- Fix gauge chart behavior when zero on the right side
- Only show ’edit subject button’ when user has edit permission
- Fix scale domain when using sum aggregation in charts
- Fix line color being inverted in embedded charts for some specific cases