Docs
Changelog
Latest updates and improvements to the Blockbax Platform.
New security features
July 1, 2026
We’ve shipped a set of improvements that give you more insight into what’s happening with your account. If you’re an organization administrator, you also get more control over how your users authenticate:
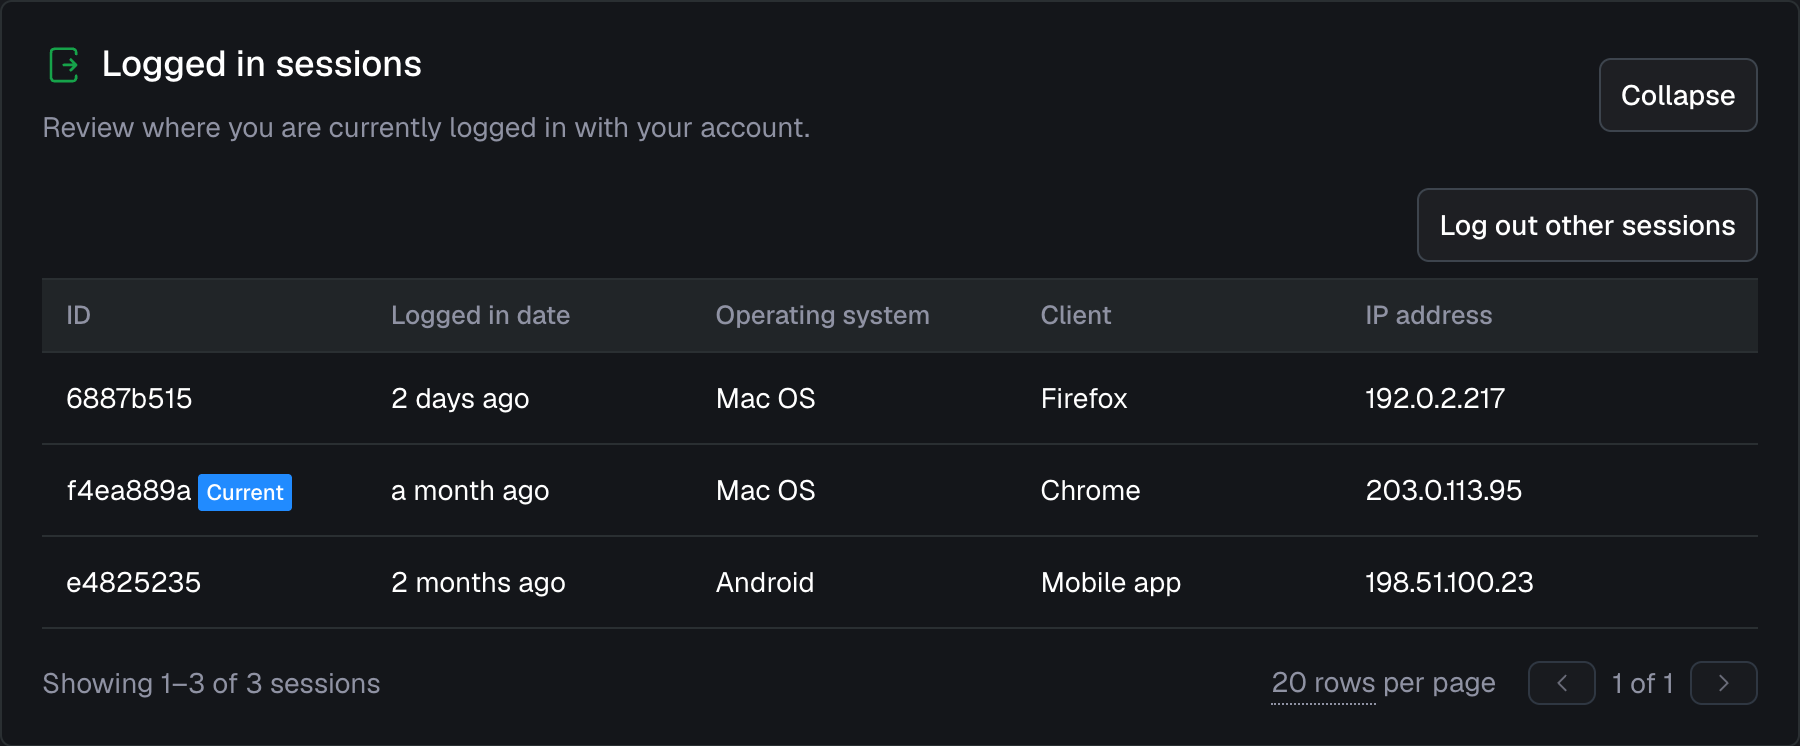
See where you’re logged in
View all your active sessions and log out of them from a single overview.Confirmation and notification for sensitive changes
We now ask you to confirm it’s really you before you change your email, password, or multi-factor authentication (MFA) settings, and we email you so you can act quickly if it wasn’t.Insight into single sign-on (SSO) and MFA usage
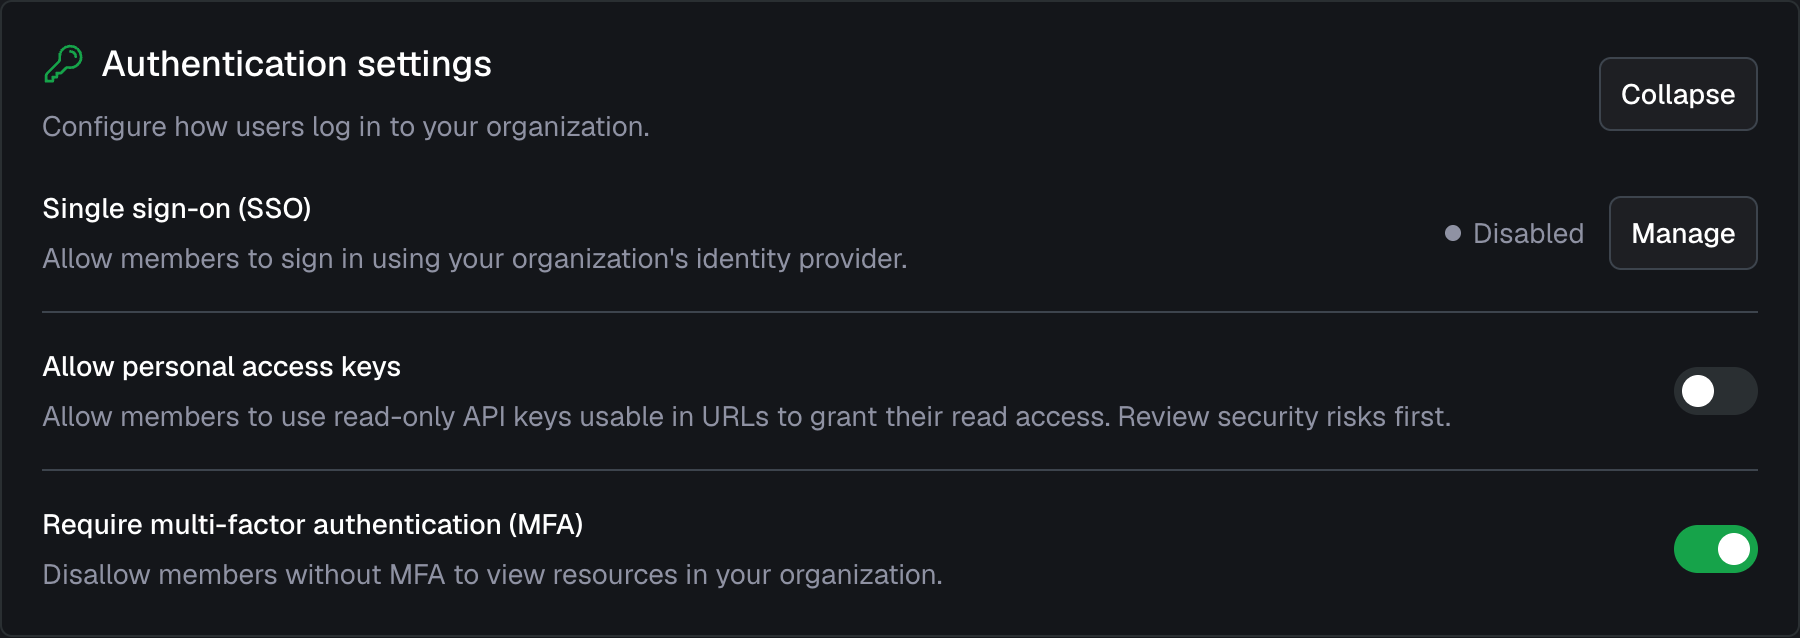
See which of your project members and organization administrators have MFA enabled and which sign in through SSO.Require MFA
Go a step further and require MFA across your organization, so members must set it up before they can access it. We recommend enabling enforcement to raise the baseline level of account security.Disallow personal access keys
Personal access keys give read-only API access to everything a user is permitted to see, which can introduce security risk. You can now disallow them for your organization, and we’ve already disallowed them wherever they weren’t in use. If you use them or plan to, we recommend reviewing the risks first.
See the organization settings and account settings for more information.
Action advised
This update logged out mobile app users who had an older session. If that applies to you, please log back in. An older version of the mobile app could get stuck on a loading screen on a logged-out session. If this happens, force close the app and reopen it.
Improvements
- A new option lets you show the subject path in table widgets.
- Alarms can now be set to automatically unacknowledge after up to a year.
- The alarm page size has increased to 50, and common actions take fewer clicks.
- The alarm overview and detail pages now show the initial event, including its description.
- The alarm overview also shows the create date in absolute form, alongside the relative date.
- The automatic SSO redirect for unauthenticated users can now be disabled for custom domains.
- You can now quickly select a time period by typing it directly into the period selector.
- SSO users now have a logout option.
Custom widgets
May 22, 2026
We’re excited to introduce custom widgets: build your own dashboard visualizations and use them alongside the standard ones. The default widget library already covers a wide range of use cases, but every project eventually has one that doesn’t quite fit a chart, gauge or table.
This opens the door to visualizations that match the way you actually look at your operation:
- Schematic visualizations of the things you monitor, like batteries, tanks, pumps or production lines. Colored by their current status or showing measurement values at specific locations, you’re in control.
- Domain-specific summaries that combine measurements, events and properties into a single view that speaks the language of your team.
- Interactive overlays that let users click through to a related subject, event or external system right from the dashboard.
Custom widgets sit right next to the built-in widgets on your dashboards, so you can mix and match without giving up anything you already have. They also benefit from the same context as other widgets, like the selected date range and the current subject in repeaters and subject dashboards.
Curious about the details, or ready to start building? Dive into the docs for everything you need to know. Want a head start? Get in touch and our expert services team will be happy to help you design and build your custom widget.
We can’t wait to see what you build with it.
Improvements
- Support Entra ID for Azure Event Hub integrations
- Added ‘Use my location’ button to set location properties in mobile app
- Added ‘Navigate to’ button to subjects in mobile app
- Added option to transpose columns and rows in table widgets
- Support GET, PUT, and PATCH in actions in addition to POST
- Show unread notifications in favicon instead of as part of title
- Added support for searching resources by UUID in Ctrl+F
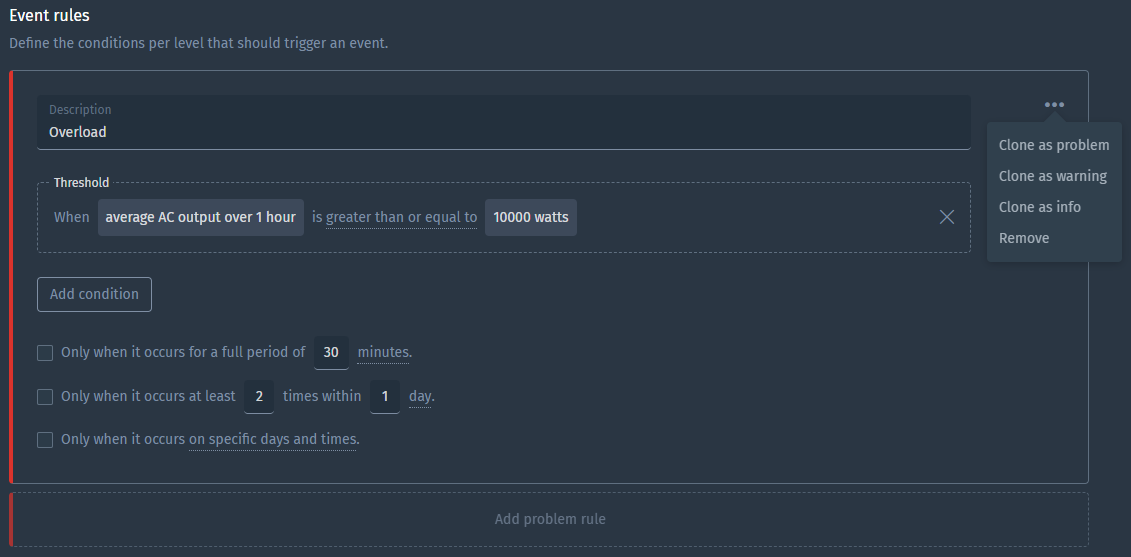
Scheduled event triggers
April 2, 2026
Event triggers evaluate conditions based on incoming measurements. But what happens when measurements stop arriving altogether?
Until now, detecting an unchanged or stale state required other measurements from the same subject to keep advancing time. With the new Advance time periodically setting, currently in beta, event triggers can evaluate on a schedule even when no new data comes in at all.
You can, for example, trigger an event when:
- A sensor hasn’t reported in over an hour
- A machine has remained idle for too long
- A valve has stayed open when it shouldn’t have
These scenarios were previously achievable using simulated metrics as a workaround. We recommend migrating away from that approach. Simulated metrics are planned for deprecation.
Open the event trigger edit page and click ‘Show advanced settings’ at the bottom to find the new setting. For more details, visit the docs.
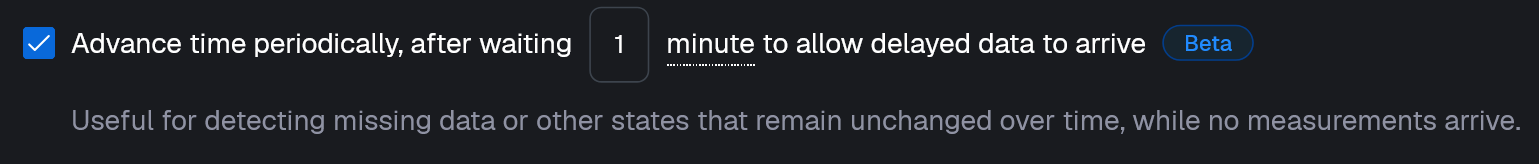
If other measurements are arriving for a subject, we recommend to consider the Advance time for other new measurements setting as well. This lets you distinguish between a truly stale condition and a case where the sensor itself has stopped reporting, which is an important difference when, for example, a valve appears to remain open simply because the device went offline. For more guidance on which setting to use when, see the docs.
Improvements
- When showing measurements on a map, you can now reverse the bounds to influence what gets drawn on top
- Browser tab titles show what specific page you are on in the web app
- Improve the editing experience of passwords and MFA settings
- Support cloning roles
Fixes
- Fix visualization of errors when applying changes from another environment
- Fix issue where grid rows cannot be expanded in Firefox
- Fix error message for NaN or infinite values when setting properties in actions
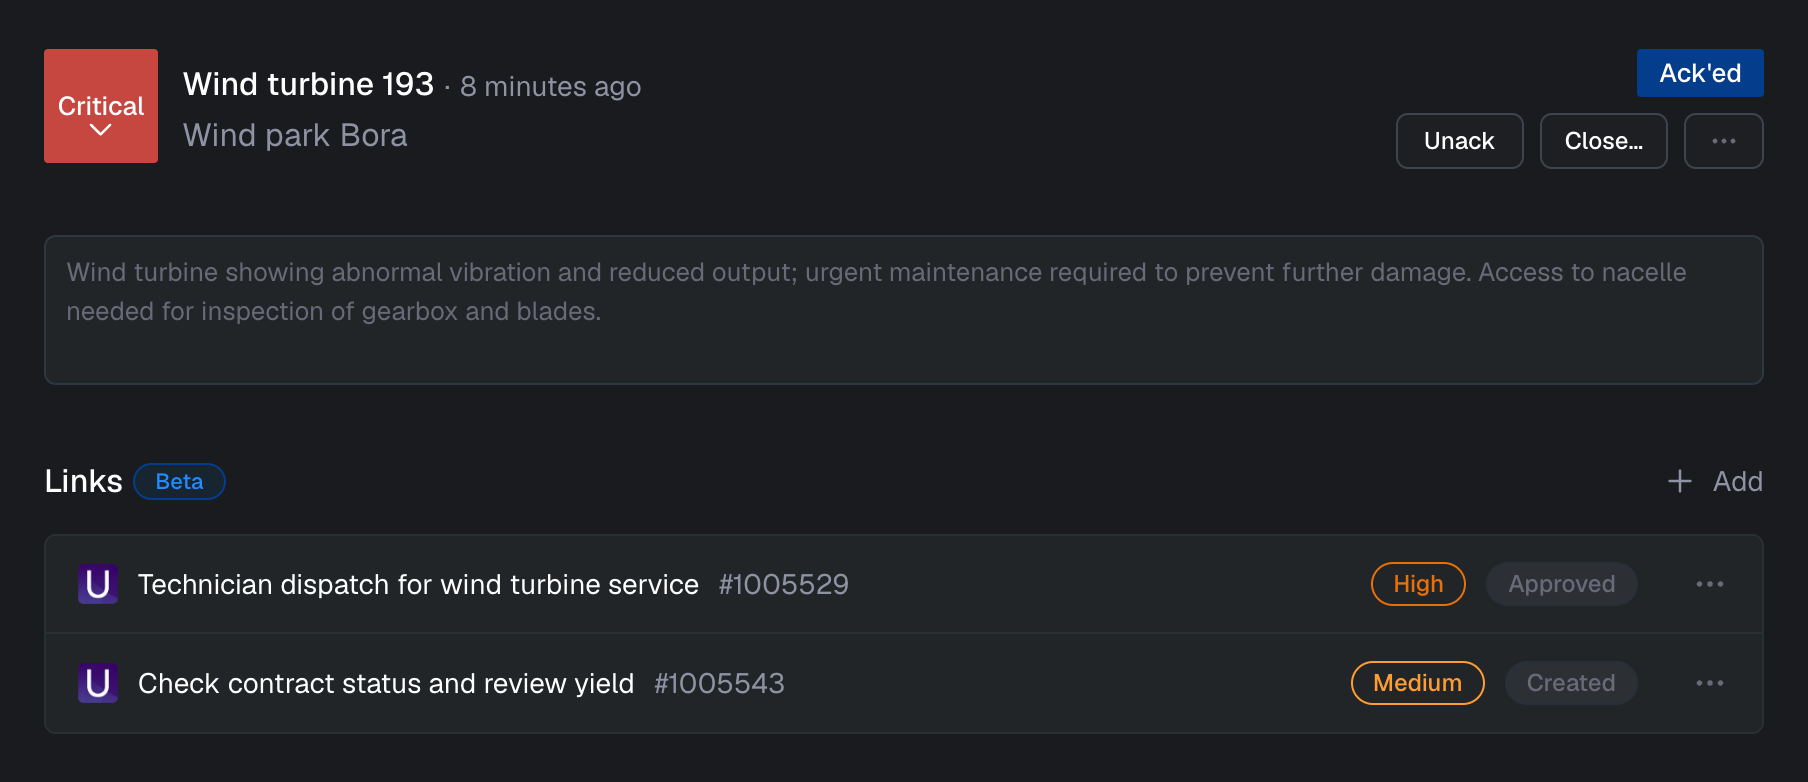
Alarm links
March 17, 2026
When an alarm occurs, resolving it often requires actions in other systems. For example, creating a ticket in a service management system or scheduling maintenance in an asset management platform. To support this workflow, you can now add links to alarms that point to related resources such as tickets, maintenance jobs, or other relevant records. This makes it easier to keep track of everything needed to resolve an alarm from a single place.
We are also starting to integrate more deeply with commonly used systems. Our first integration with Ultimo is currently in beta. While you can add any URL as a link to an alarm, links to Ultimo jobs become even more powerful as we recognize these links and render their status directly in Blockbax. Reach out if you’re interested in enabling the Ultimo integration.
Fixes
- Fix duplicate global find results for users with limited access
- Fix global find showing no results when using a personal access key
- Fix issue that prevented users from changing their multi-factor authentication settings
- Fix access key permissions not being displayed when a permission set was selected
- Fix issue when selecting date ranges when in a different timezone than the project
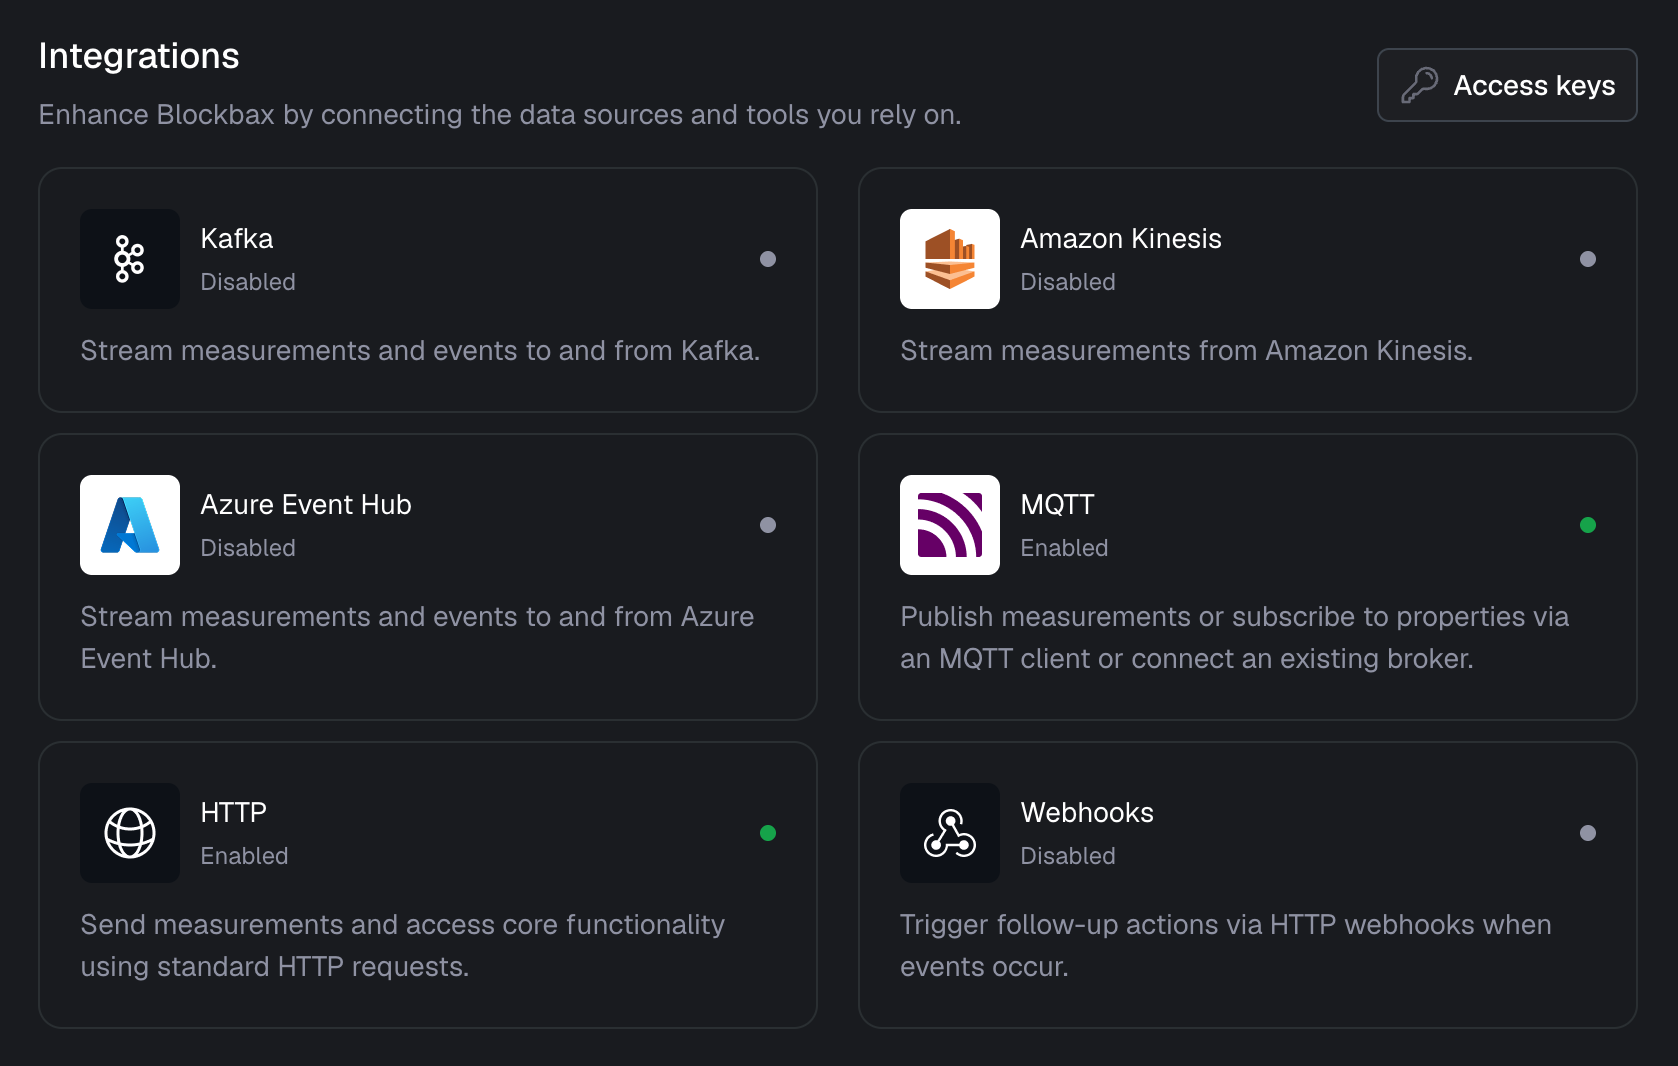
New Integrations overview
February 27, 2026
Integrations with other tools and technologies have become an increasingly important part of our product. As we continue to expand our integrations, we believe they deserve a more central place in the interface.
Previously, different types of integrations were spread across multiple tabs within the Settings page. We have now introduced a dedicated Integrations page in the sidebar, which brings together all available integrations in one clear overview. You can instantly see which integrations are active and manage them from a single place. While the structure has changed, the underlying functionality remains the same. Everything you’re used to is still there, just better organized and easier to find.
We have also improved the setup flow for new integrations. When adding an integration, we now guide you more clearly in creating and using the correct type of access keys, making the setup process smoother and more intuitive.
This update lays the foundation for many more integrations to come, and makes it easier than ever to manage them.
Fixes
- Fix time-zone warning banner to not appear when the time zone is effectively the same (e.g. Amsterdam vs Paris)
- Fix the depth validation of the subject type hierarchy to allow more nesting
- Fix alarm detail page being broken in specific cases
Paging in the Explorer
February 10, 2026
We have made a small but often requested improvement to the Explorer: paging through subjects! Before, the Explorer was limited to twenty subjects and if you wanted to see subjects not in this initial set, you had to change the subject filter. Now, you can page through all relevant subjects with the paging buttons at the bottom of the list.
Happy paging!
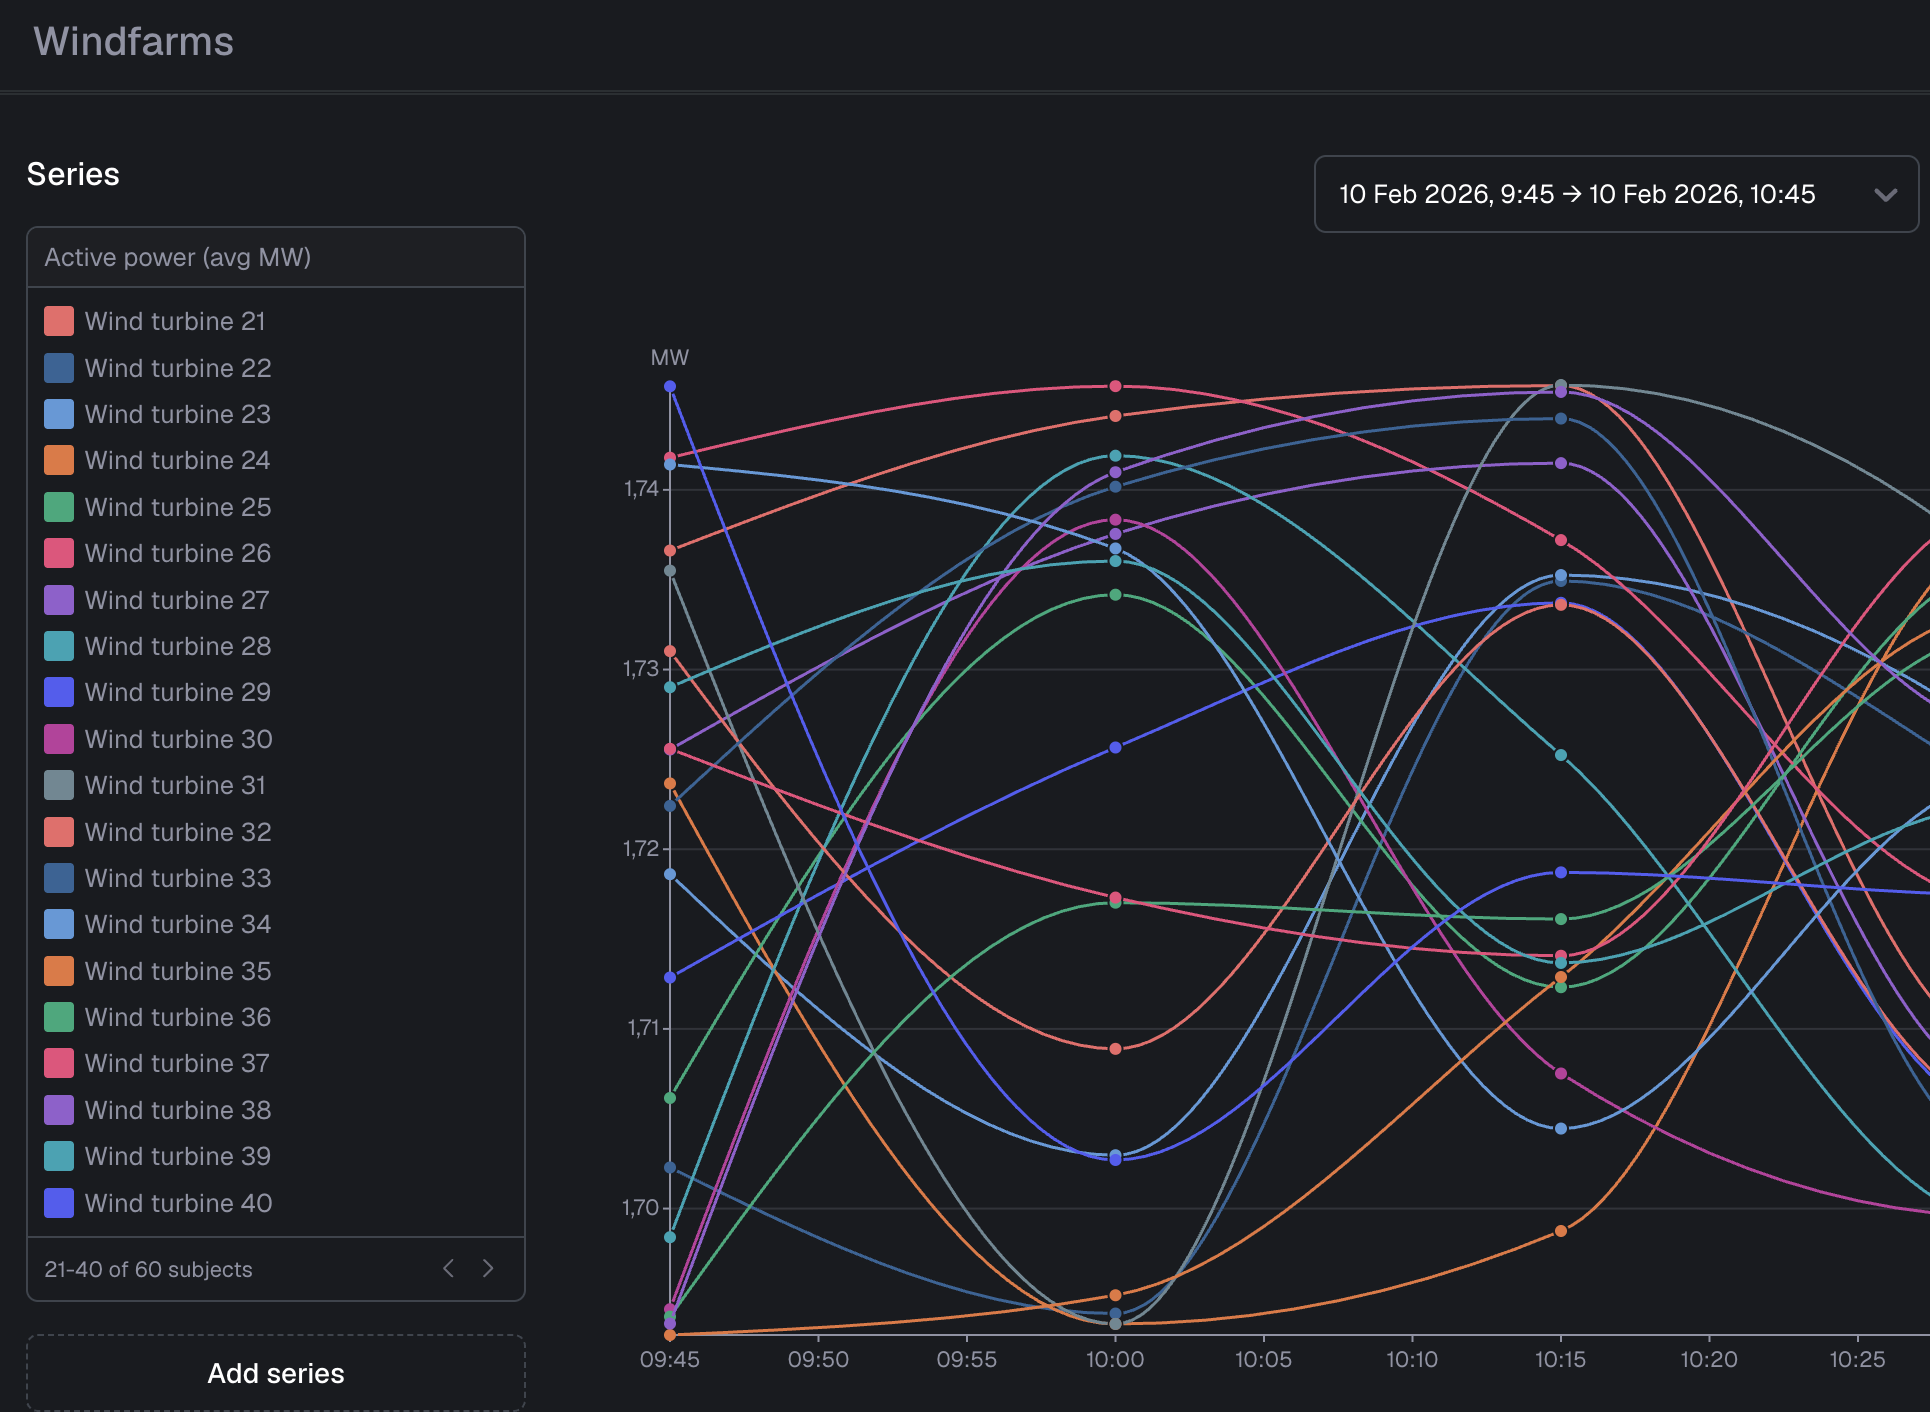
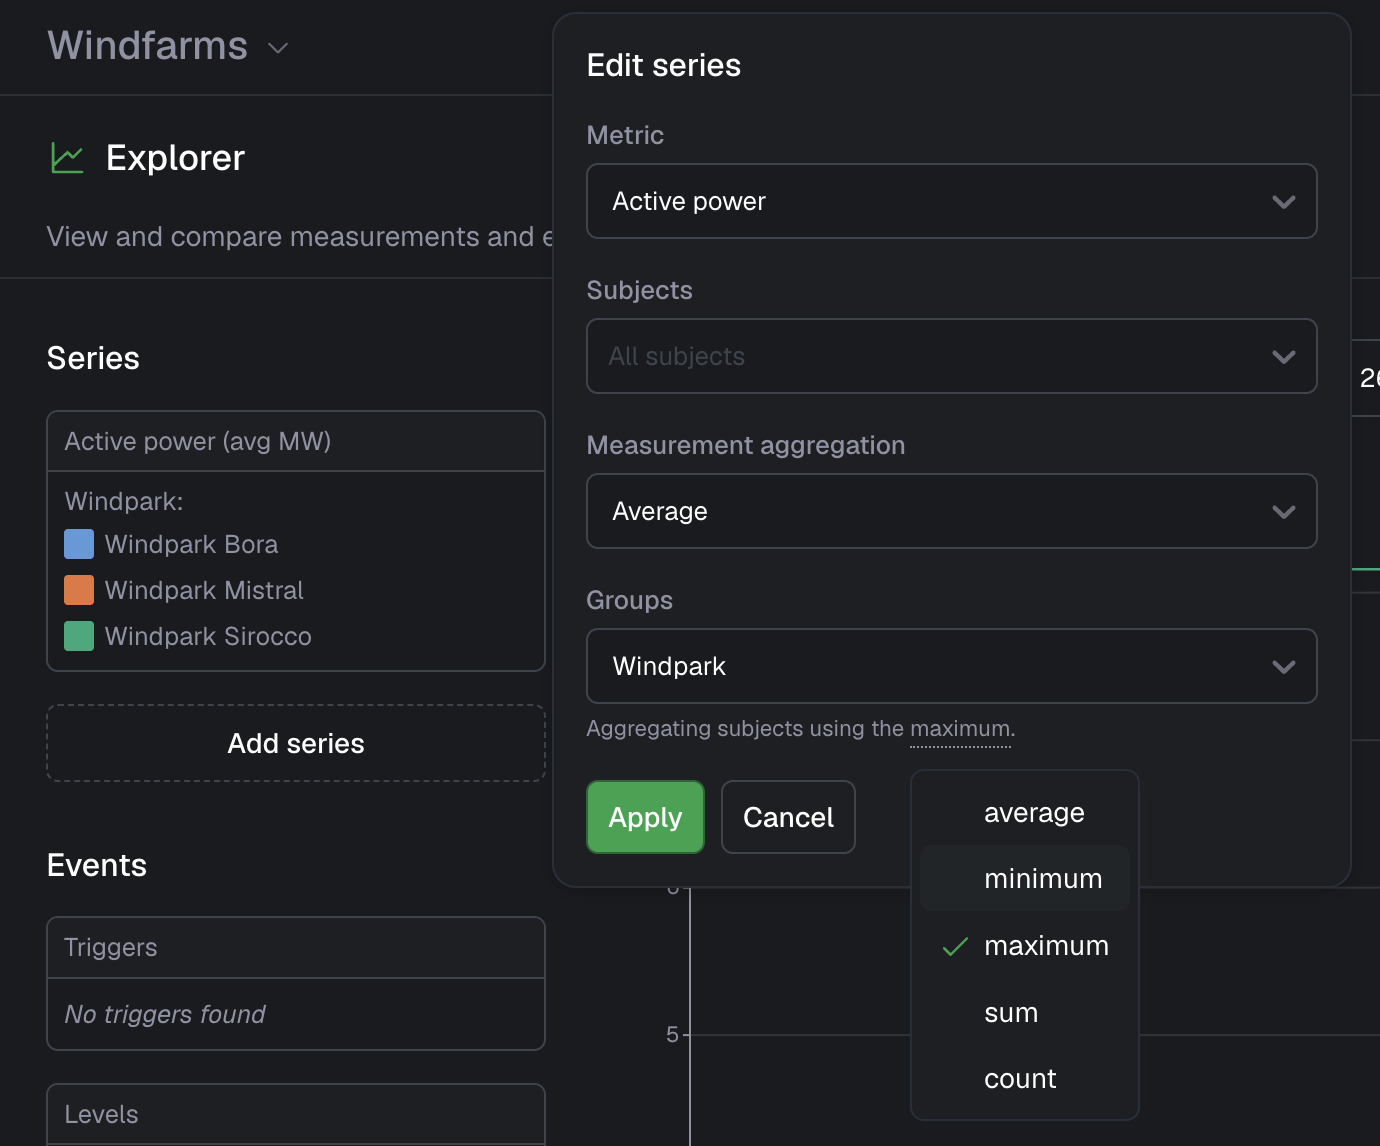
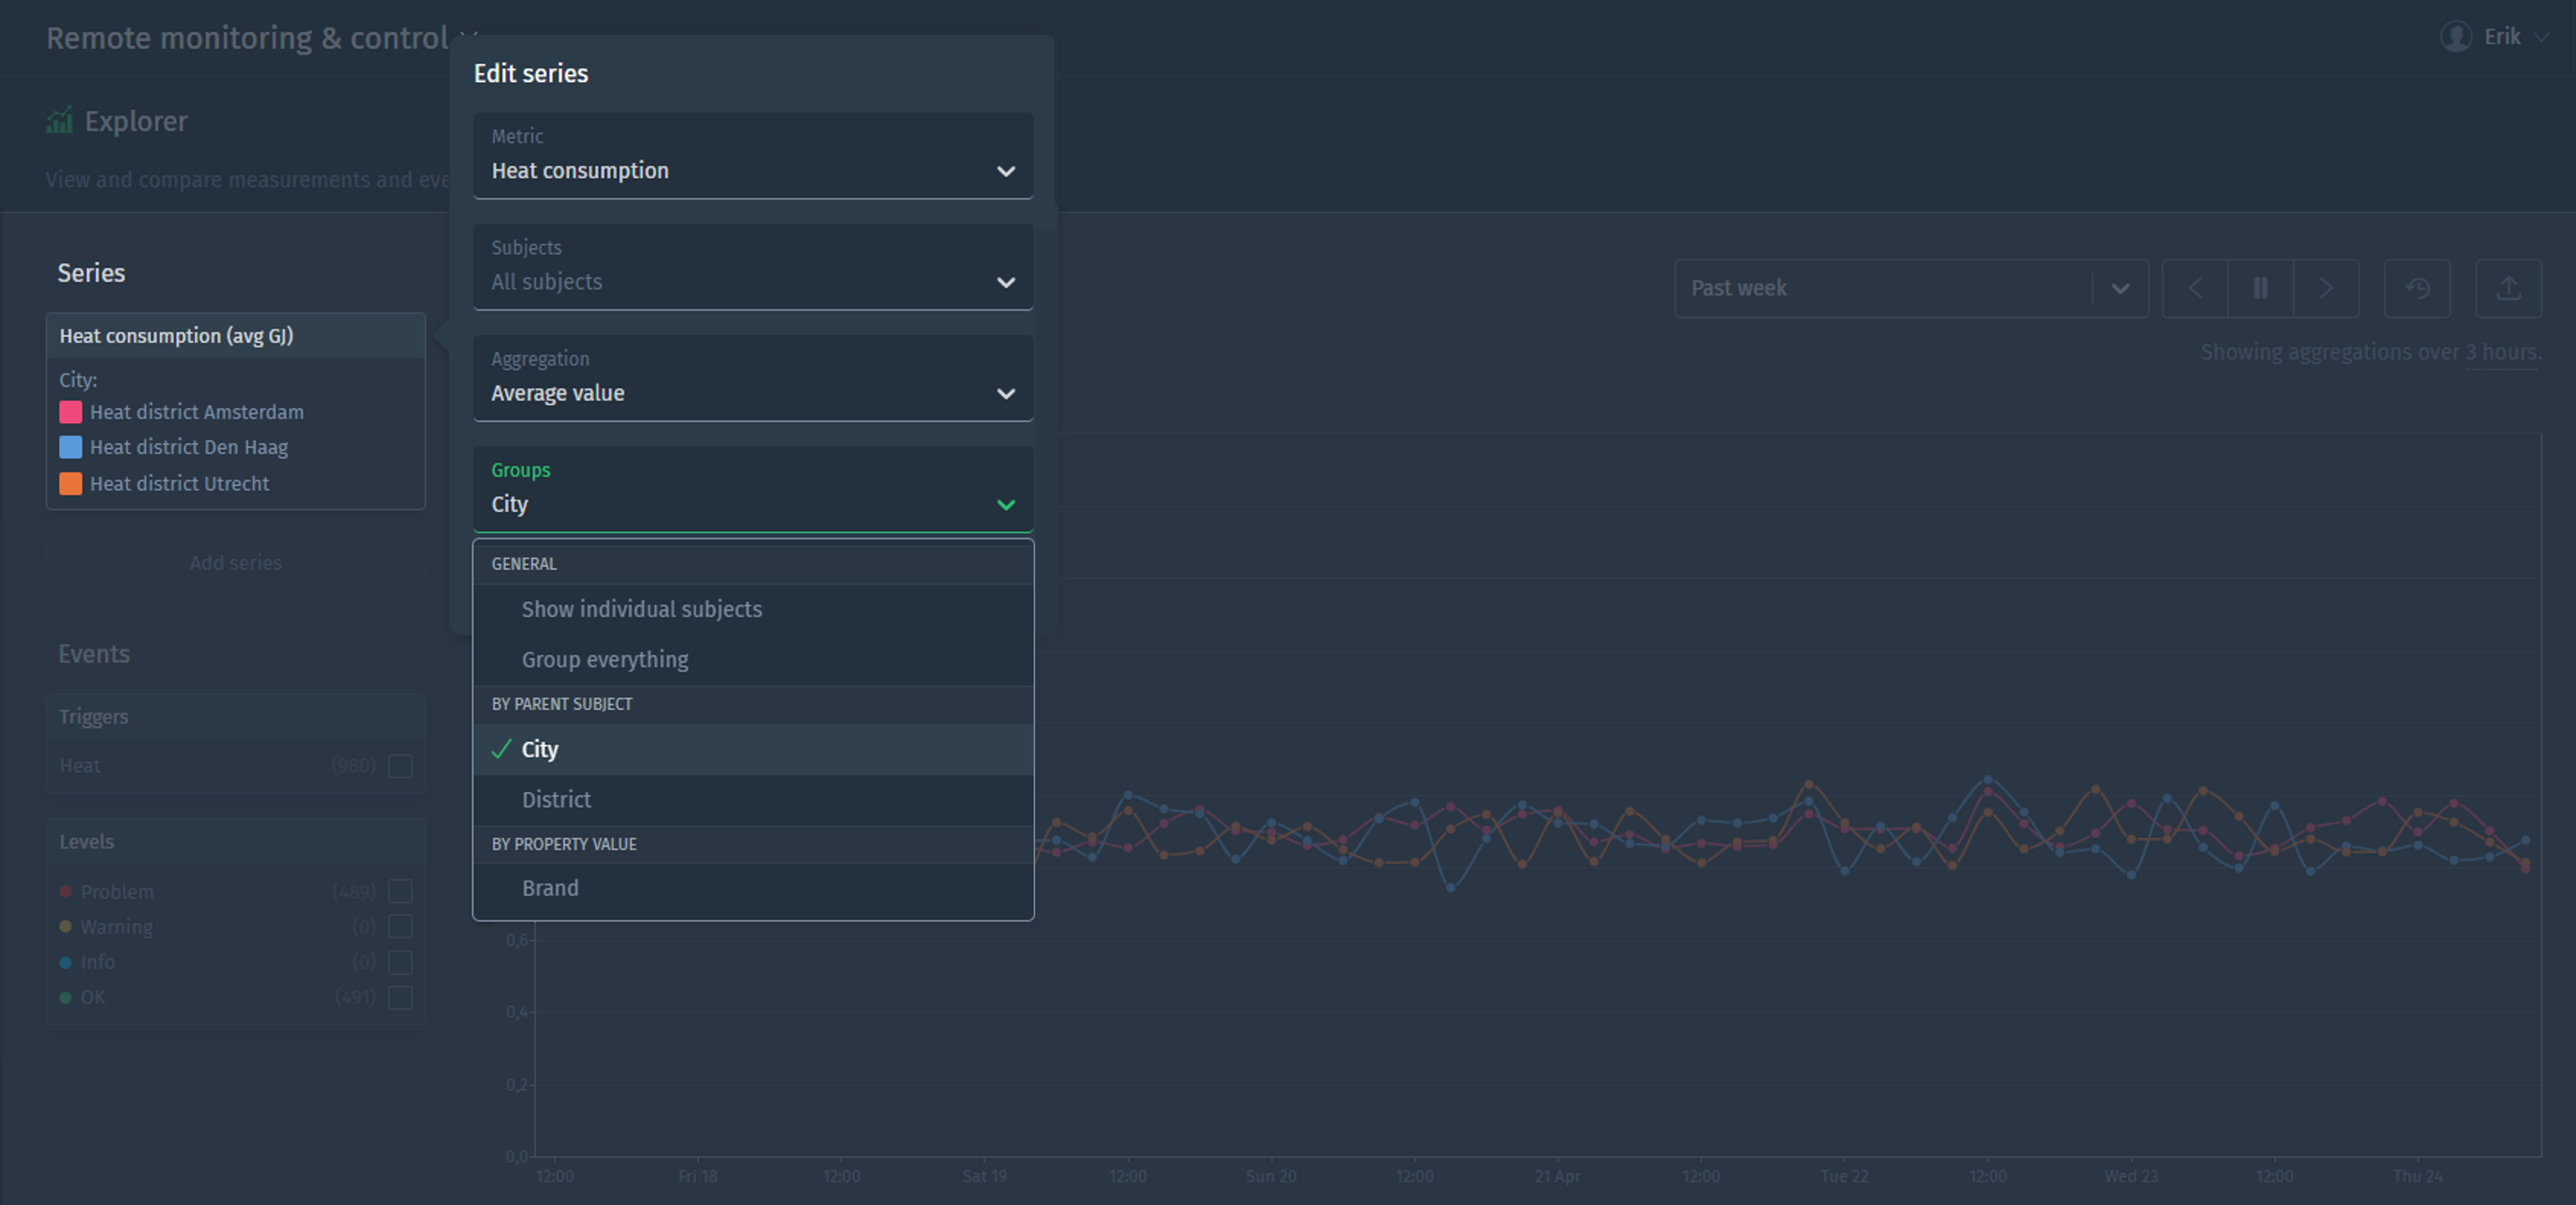
Two-level aggregations
February 3, 2026
We are happy to announce that we have added support for two-level aggregations in the Explorer, chart, and single value widgets! This feature gives you more flexibility when working with grouped data by allowing you to apply a different aggregation function at the subject level than at the measurement level.
In many real-world scenarios, you don’t want to aggregate everything using the same function. Instead, you often need to calculate values per group (e.g. per turbine, customer, or location), and then combine those results into a single overall metric using a different aggregation function. Until now, the same aggregation function was used for both aggregating measurements and aggregating subjects.
With two-level aggregation, you can now:
- Aggregate measurements per subject with one function (e.g. average), and then
- Aggregate those subject results with another function (e.g. sum)
This makes it possible to answer questions like:
- What is the sum of average power usage across all my assets?
- What is the maximum average turbine active power per windpark?
All aggregation functions (min, max, sum, average, and count) are supported at both levels.
Improvements
- Add support for calendar periods (“Today”, “This week/month/year”) in addition to the already existing “Past day” et cetera
- Show ’now’ decoration in all line and bar charts
- Support smaller aggregation periods than before
- Allow hiding the subject label in the Map widget
- Show synchronized hover state on event detail page
- Increase timeout in actions from 10s to 25s
- Add support for custom client IDs in MQTT
- Support custom colors for metrics, and scatterplot threshold and regression lines
Fixes
- Fix QR code scanning in mobile app
- Fix unexpected error when sorting on event trigger column in the events overview
- Fix route visualization issue when crossing 180th meridian
- Fix event-trigger-specific notification settings not being respected
- Fix high memory usage in browser
- Fix an issue that prevents you from closing an alarm
- Fix an issue in DTAP that prevents applying changes when there is a role with no permissions
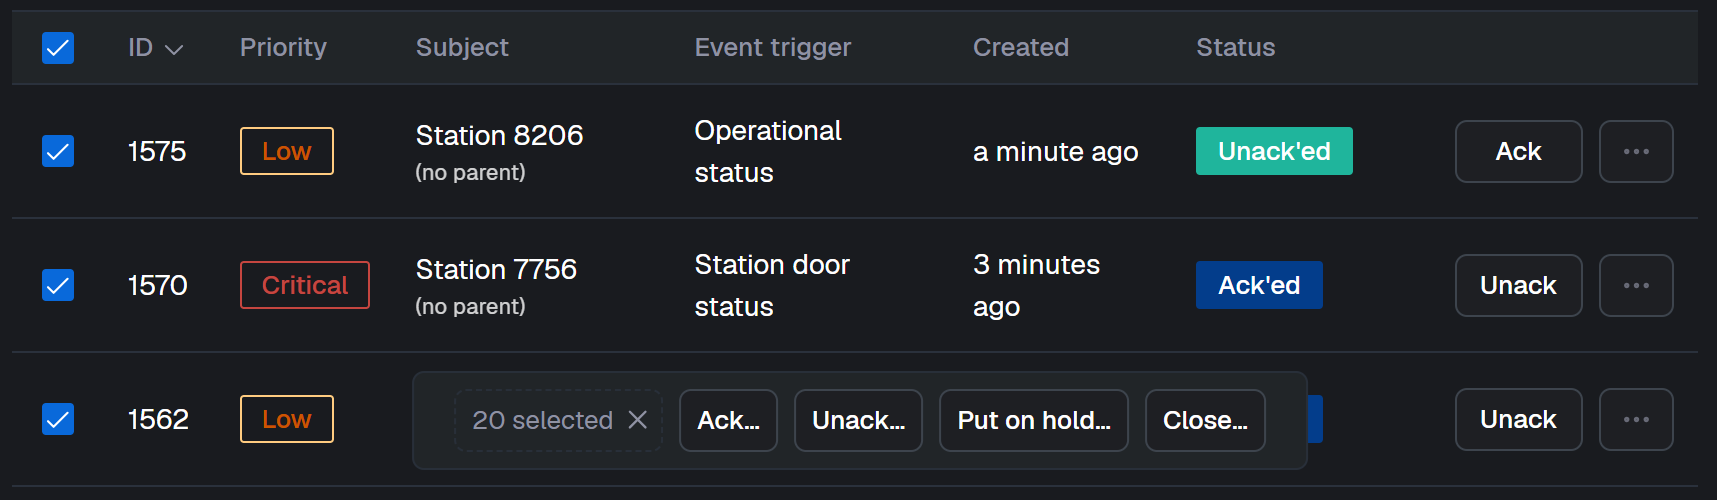
Multi-select alarms
October 14, 2025
We noticed that users of alarm management often need to acknowledge multiple alarms one by one after an outage or other events that triggered many alarms. To make this process more efficient, we introduced multi-select for alarms, allowing you to take action on multiple alarms at once.
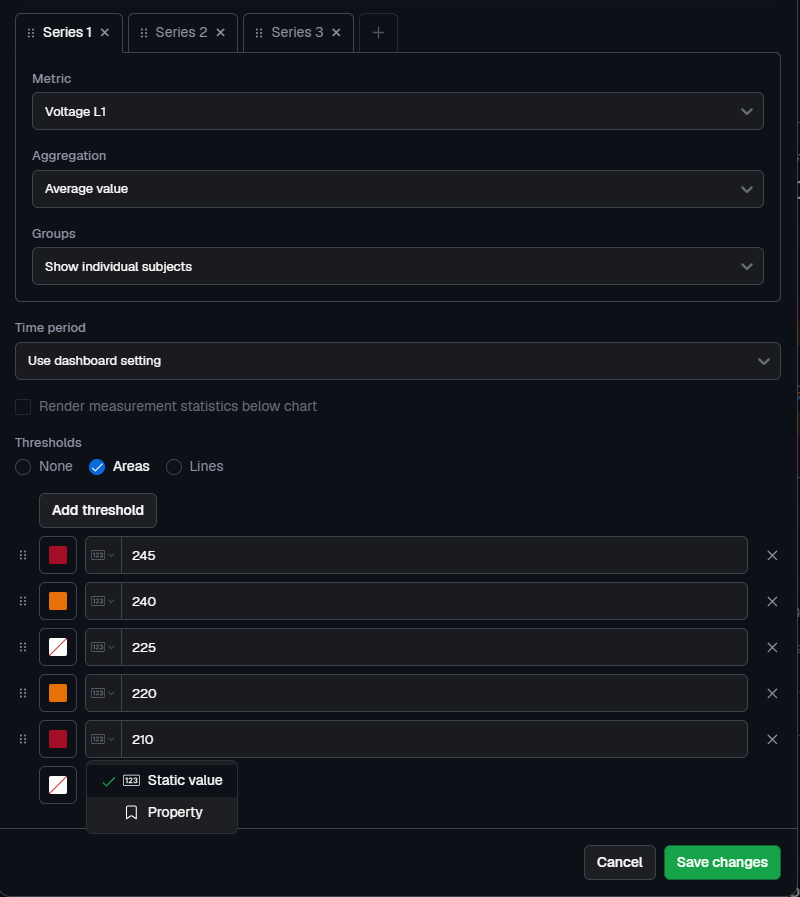
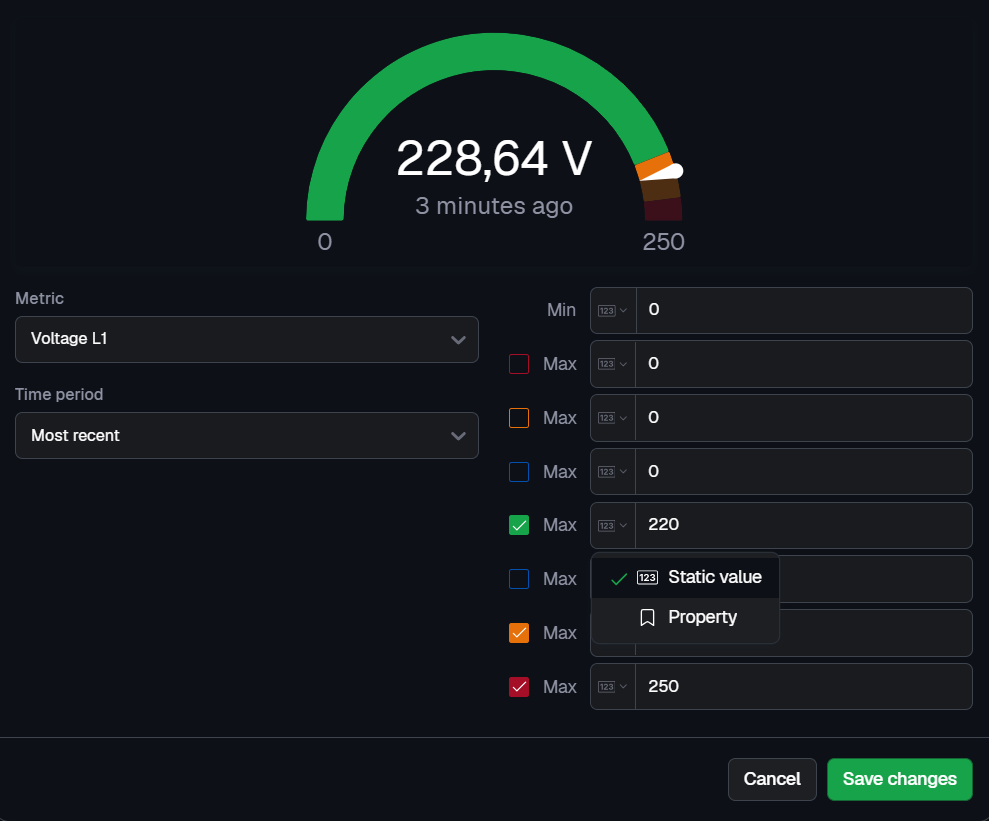
Properties in dashboard widgets
Oops, we forgot to announce this beauty! You might have caught a glimpse of it in the changelog about threshold lines and areas - we believe it deserves more spotlight. You can now use properties in many dashboard widgets to set values dynamically. This helps display different thresholds based on a specific property of the asset.
Improvements
- Allow searching alarms by ID and filter them by status
- Allow filtering events based on event rule descriptions
- Ease webhook URL length constraints
Fixes
- Fixed styling of error messages rendered on top of charts
- Fixed excessive precision of values in scatter plot zoom area
- Fixed selecting dashboard name when clicking to edit in Safari
- Fixed error when trying to close an alarm from the alarm detail page
- Fixed map sometimes crashing when refreshing static subject locations
Global find
October 8, 2025
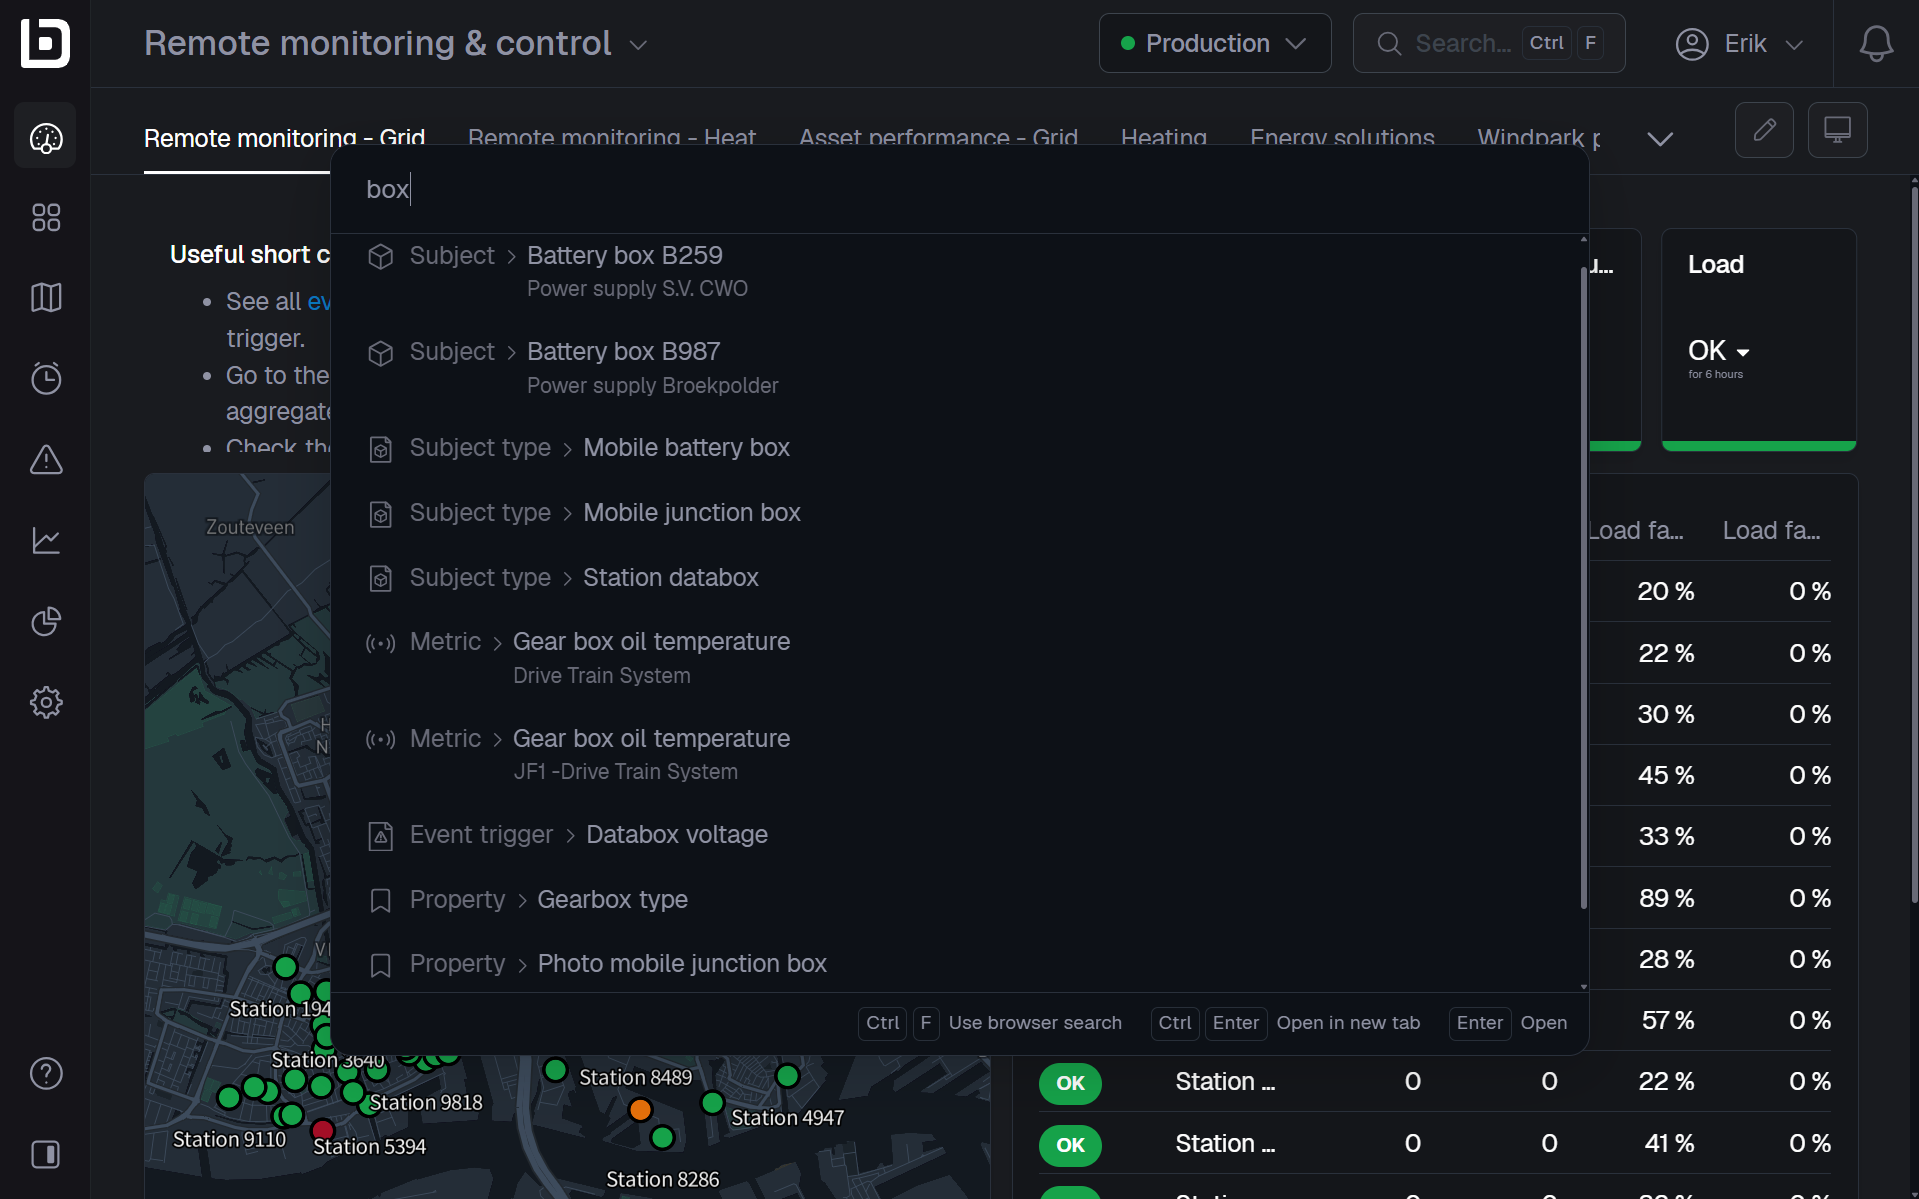
Finding and navigating to specific resources in the web app just got easier. Previously, you had to navigate to the overview page of a resource type before searching. With the new Global Find feature, you can now search for and access any resource, e.g. event triggers or alarms, from anywhere in the web app using CTRL + F. This opens a search bar that lets you quickly locate resources across all resource types in one place.
Scatterplot improvements
September 30, 2025
We’re excited to announce new enhancements to our scatterplot dashboard widget. These improvements make it easier to uncover trends and spot anomalies in the correlation between metrics. We have introduced regression lines and reference lines, along with several other improvements.
- Regression lines show the overall trend or relationship between two metrics. You can configure different algorithms in the widget settings, including linear, polynomial, exponential, logarithmic, power law, or smoothing.
- Example: Wind speed vs. power production (understanding wind turbine performance).
- Example: Asset age vs. failure rate (predictive maintenance).
- Reference lines let you manually set specific values or thresholds to track against KPIs.
- Example: Acceptable limits.
- Example: Warranty levels.
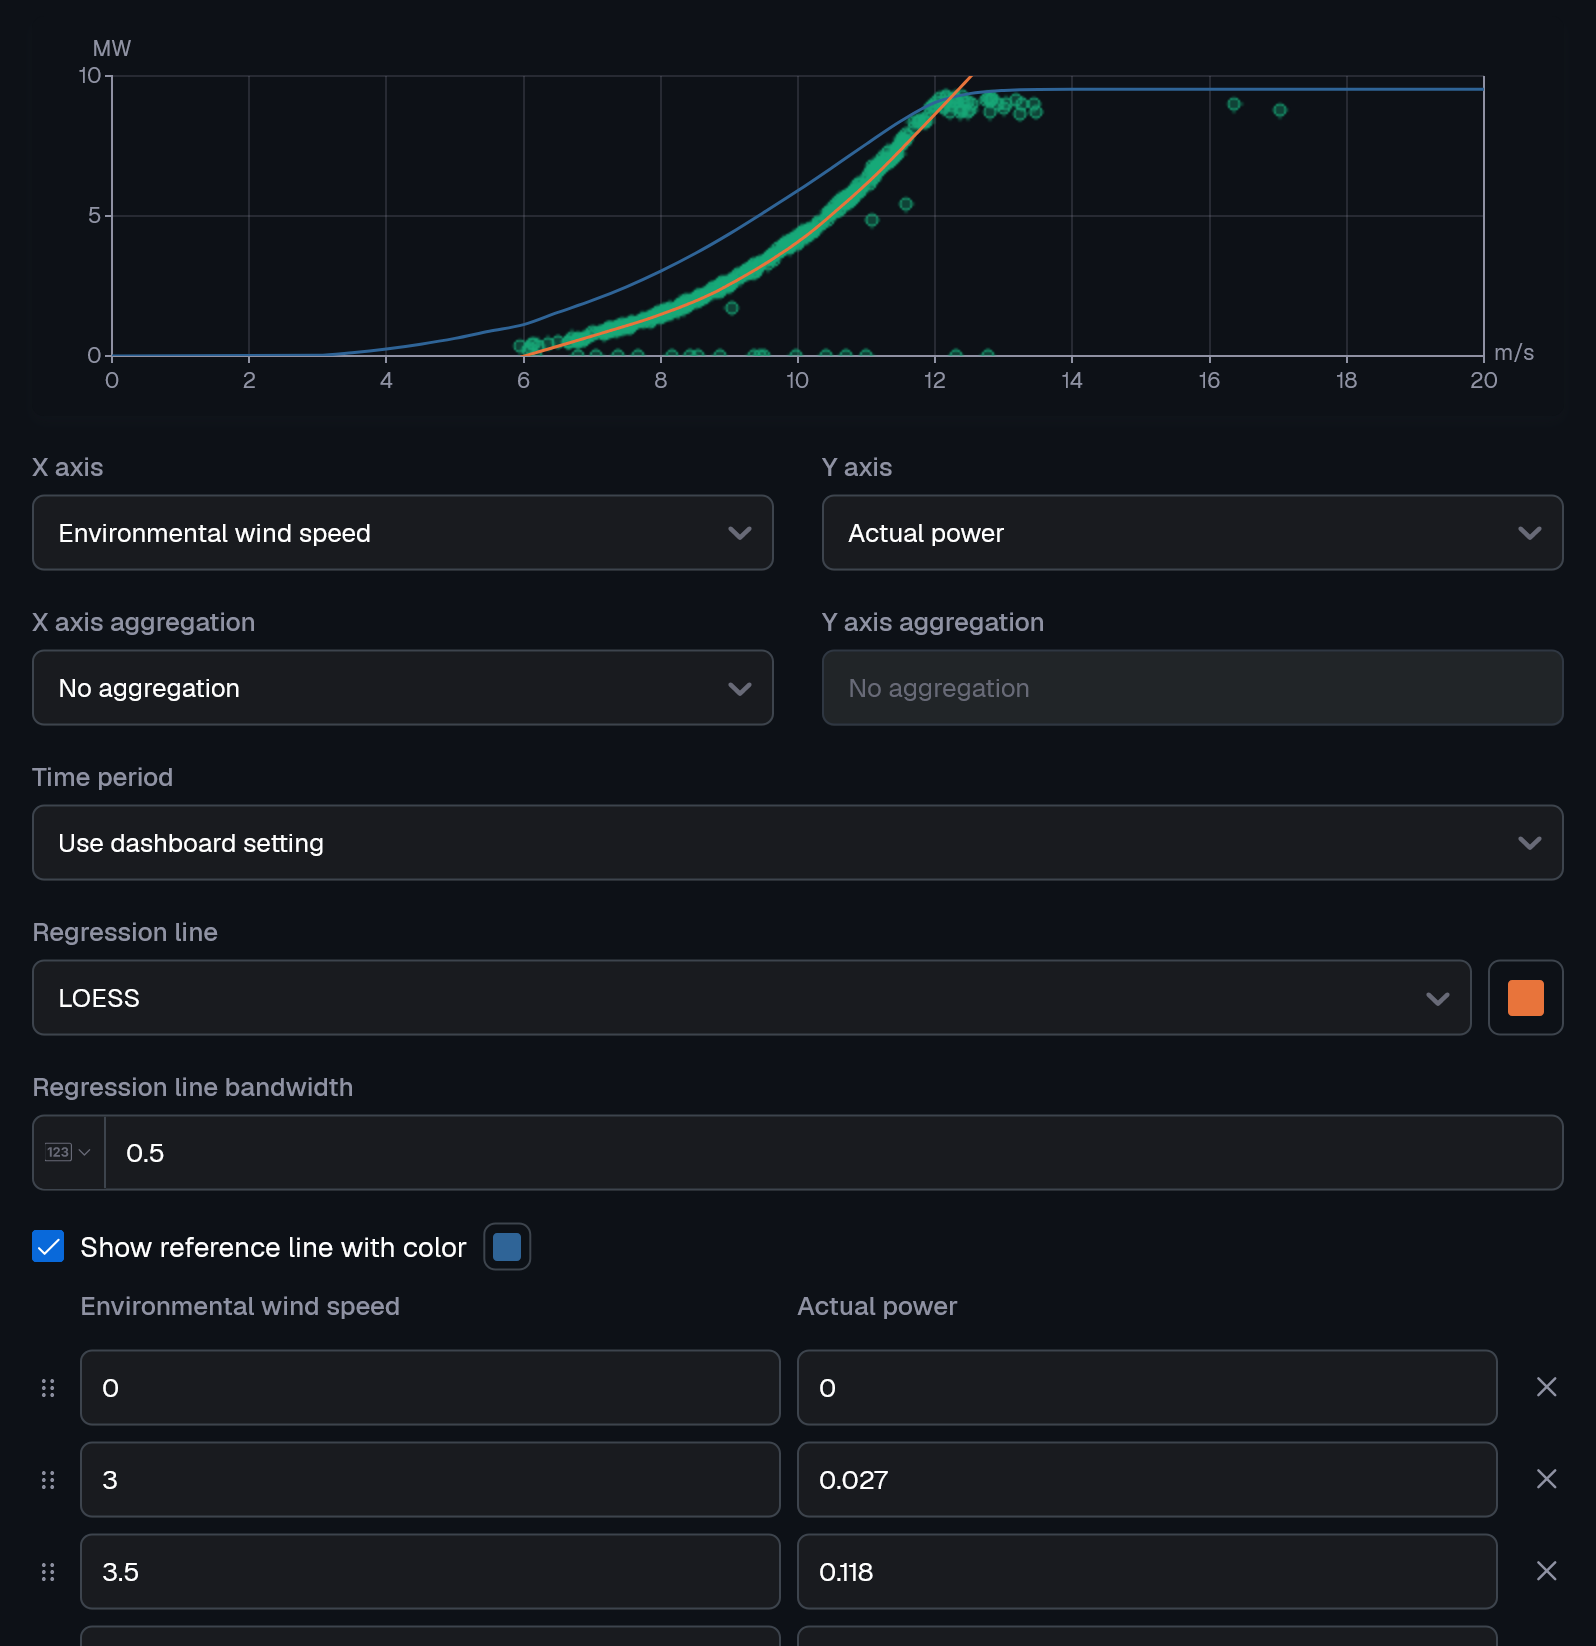
Beyond regression and reference lines, the scatterplot widget now includes:
- Aggregations: Compare minimums, maximums, or other statistical combinations across your dataset.
- Interactive zooming: Select an area by dragging to zoom in, making it easier to explore details in dense data clouds.
- Dot sizing & transparency: Spot recurring patterns instantly - similar values are shown as larger dots and transparency is added to ensure overlapping dots remain visible.
Improvements
- Close UI dialogs and tooltips with the Escape key
Fixes
- Fix UI highlight after adding new dashboard panels and condition sets
- Fix API to accept null values in collection based request parameters
Multiple environments
September 9, 2025
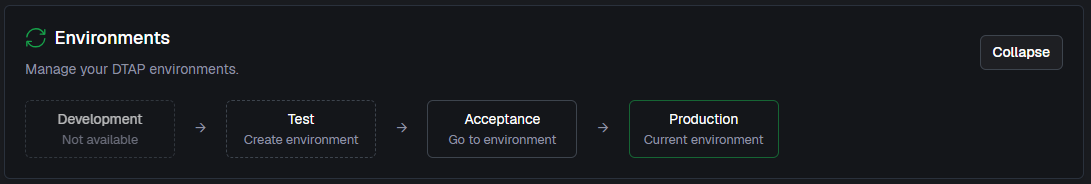
It’s been a while and that is not because of the holidays. We’ve been heads-down working on something big! Today we’re excited to announce our latest feature: Environments. Blockbax is one of the few SaaS platforms that lets you safely test your changes before releasing them to end users. Whether you’re deploying a handful of new assets or rolling out an entire asset composition, you now have a controlled way to do it.
Configure your environment setup. From a simple test + production setup to a full DTAP line (development, test, acceptance, production).
From the top bar, you can easily switch between environments and perform actions.
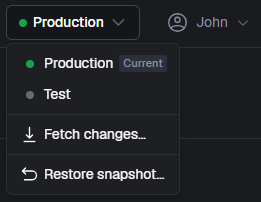
When fetching changes, you can configure what you want to sync in detail. Select a subset of resources when they are physically deployed or don’t sync certain resources when you still have to do some tests before they are ready to be monitored.
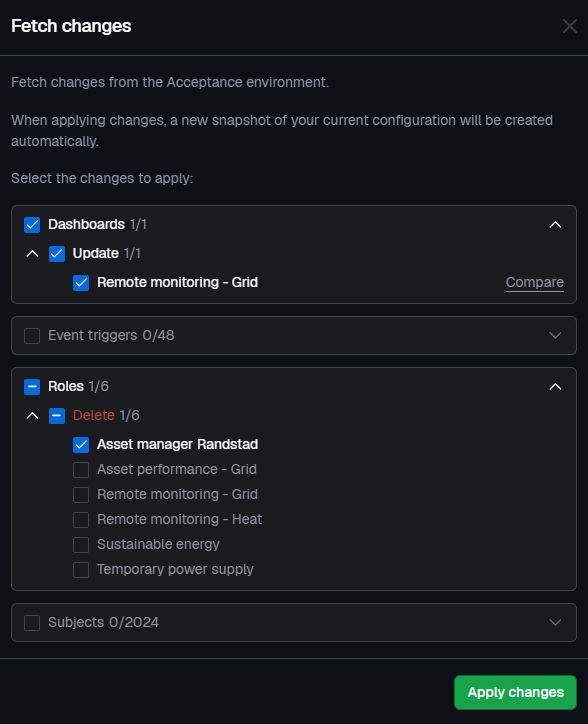
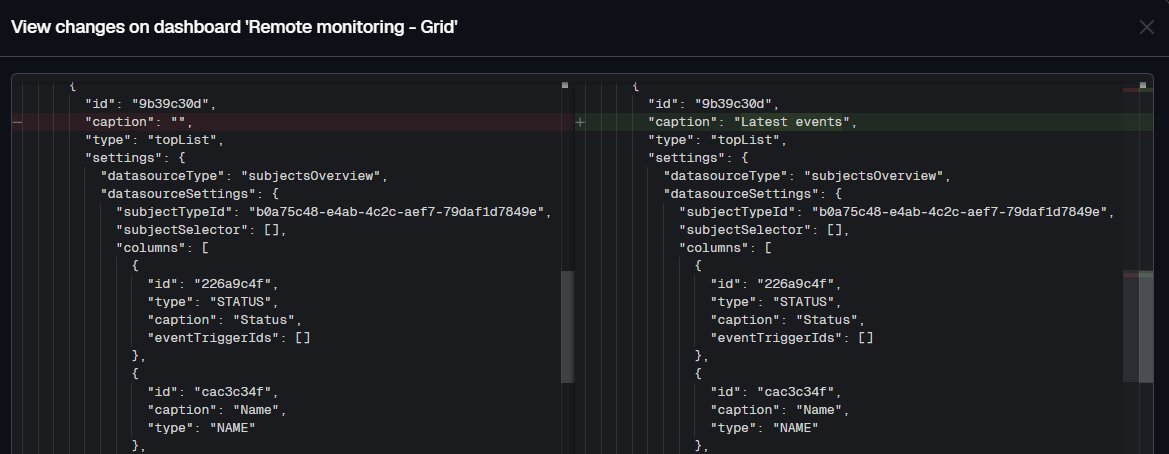
Curious (or forgot) what will change? By clicking on ‘compare’, you can inspect the diff to see the details.
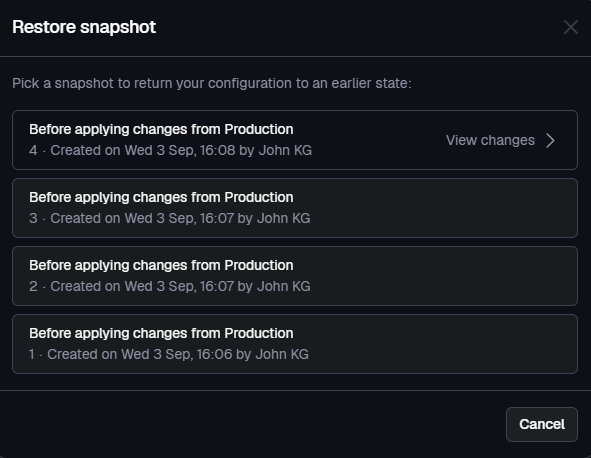
A snapshot is automatically created right before every release. This ensures that a backup is always present, enabling you to roll back if needed.
Syncing between environments only applies to your modeled resources (like dashboards and triggers). Measurements and events are not synced.
Multiple environments are only available to users on our Enterprise plan - contact us if you are interested in trying it out. For a full overview of the functionality visit the docs.
Improvements
- Improved speed of forecasted metric training; it is now four times as fast.
- By default, no period is selected when viewing the audit log to allow for infinite scrolling
- Allow choosing a value from a drop-down when calling an action with a parameter linked to a property type with predefined values
- Add blue color option for gauge and threshold lines
- Make properties and ingestion IDs collapsible in subject edit page
- Do not prefill the data type of a property type so that it becomes a conscious decision
- Improved date conversion in the Python SDK
- Show dropdown of dashboard tabs not fitting on one line also in edit mode
Fixes
- Fix missing back-filling data for forecasted metrics
- Fix visual bug in explorer for metrics without a unit
- Fix unsaved changes popup after saving dashboards
- Fix zooming on the map on touch devices
- Fix the positioning of tooltips so that they are always visible
- Fix an API edge case where inherited properties of the parent subject were not propagated to child subjects
New look and feel
August 11, 2025
Behind the scenes, we’ve been working hard on something exciting: a brand-new look and feel for our web app! You’ll now notice a refreshed, modern design across the platform. We’ve updated our colors and icons to bring a more polished, cohesive experience with improved contrast and visual clarity.
These visual updates are part of our ongoing effort to improve usability while keeping the experience intuitive and familiar. We hope you enjoy the upgrade, and as always, your feedback is welcome.

Extended aggregation options
April 24, 2025
From day one it has been possible to show measurements for individual subjects or aggregated over all subjects. Now it is also possible to aggregate measurements grouped by parent or property. The feature is available in bar and line charts as well as in the Explorer:
Useful examples include maximum values of energy meters by brand (group by property value) or showing the average temperature for production units grouped by the heat network they are in (group by parent subject).
Improvements
- New options to filter alarms based on priority, active and created date
- Show validation message when inbound connector test payload is too large
- Allow hiding points in embedded line charts
Fixes
- Fix the issue that the repeater was not reset when discarding dashboard changes
Threshold lines and areas
April 15, 2025
We are thrilled to announce the release of a powerful visualization feature! You can now enable threshold lines or areas in your line and bar chart widgets.
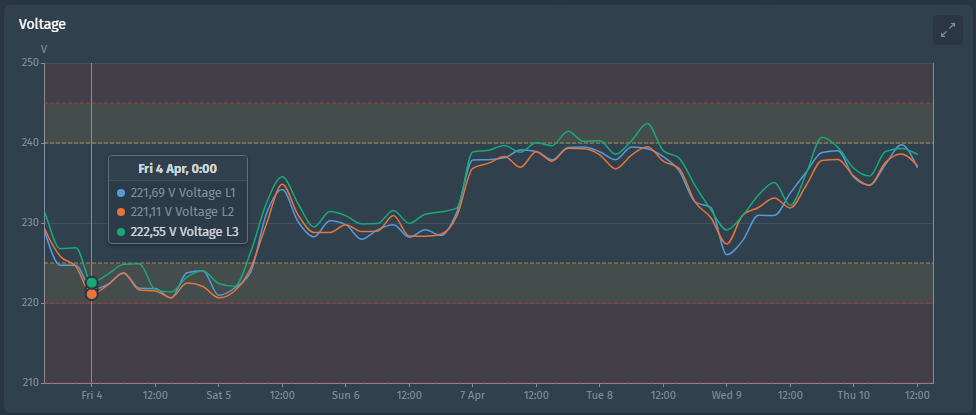
You can use a static value or subject properties to set the thresholds, which allows for customized thresholds for each subject. When you use a property for both an event trigger and a threshold line, you ensure that the same value is used to guarantee consistency.
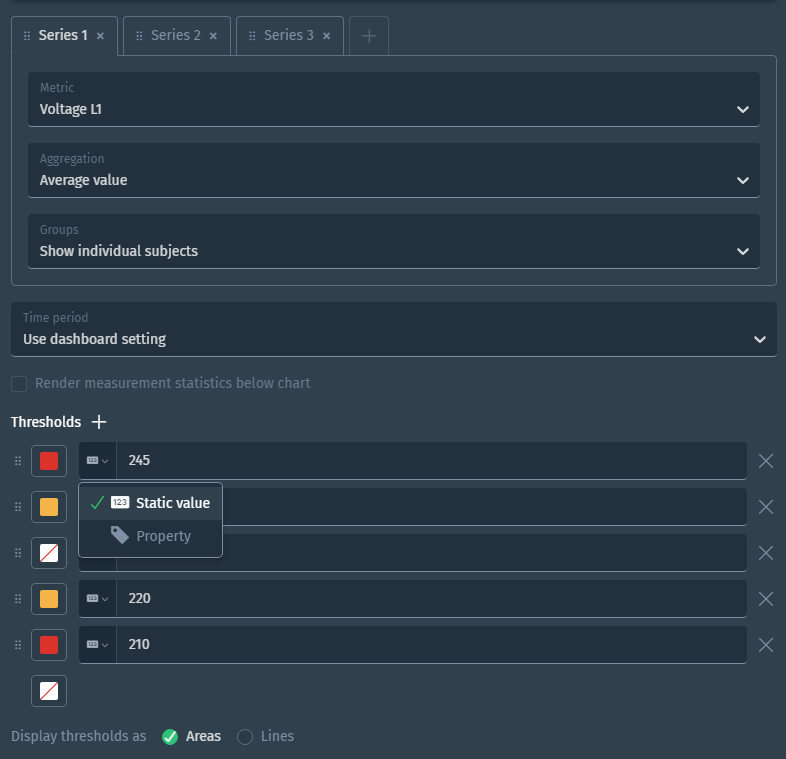
We can’t wait to see how you’ll use thresholds to improve insights and speed up data analysis. Happy configuring!
Improvements
- Remove unused option for latest event date column from subject overview page to speed up performance
- Disallow changing subject type of an existing event trigger to avoid confusion
Fixes
- Fix unexpected error on white labeling page
- Fix padding of placeholder text in empty table widget
- Fix unexpected error when rendering group-by options in Explorer
- Correctly handle group-by configuration errors in line and bar widgets
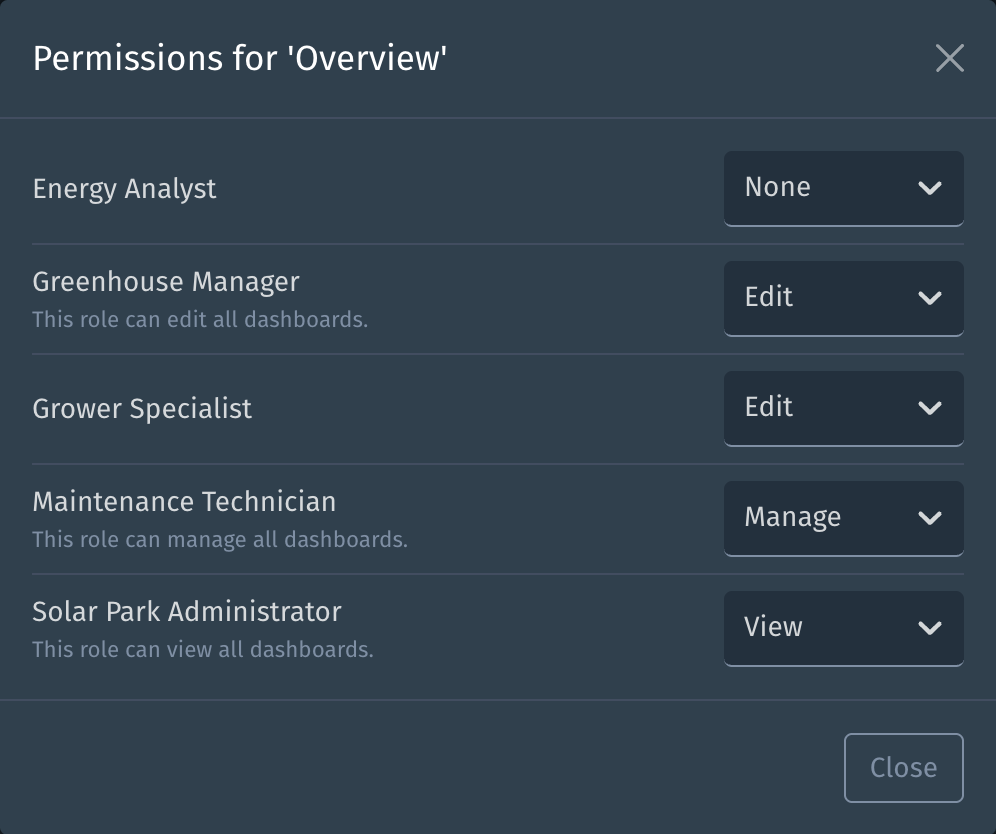
Subject type dashboard permissions
March 31, 2025
We’ve introduced new functionality that gives you more control over the visibility of subject type dashboards! Previously, if you had access to a subject type, you could see all associated dashboards. Based on customer feedback, we’ve now introduced more granular control.
Just like global dashboards, access to subject type dashboards can now be restricted using permissions within a user role. This means you can tailor dashboard access based on roles—ensuring, for example, that a technician sees different insights than an operator, engineer or any other role within your organization!
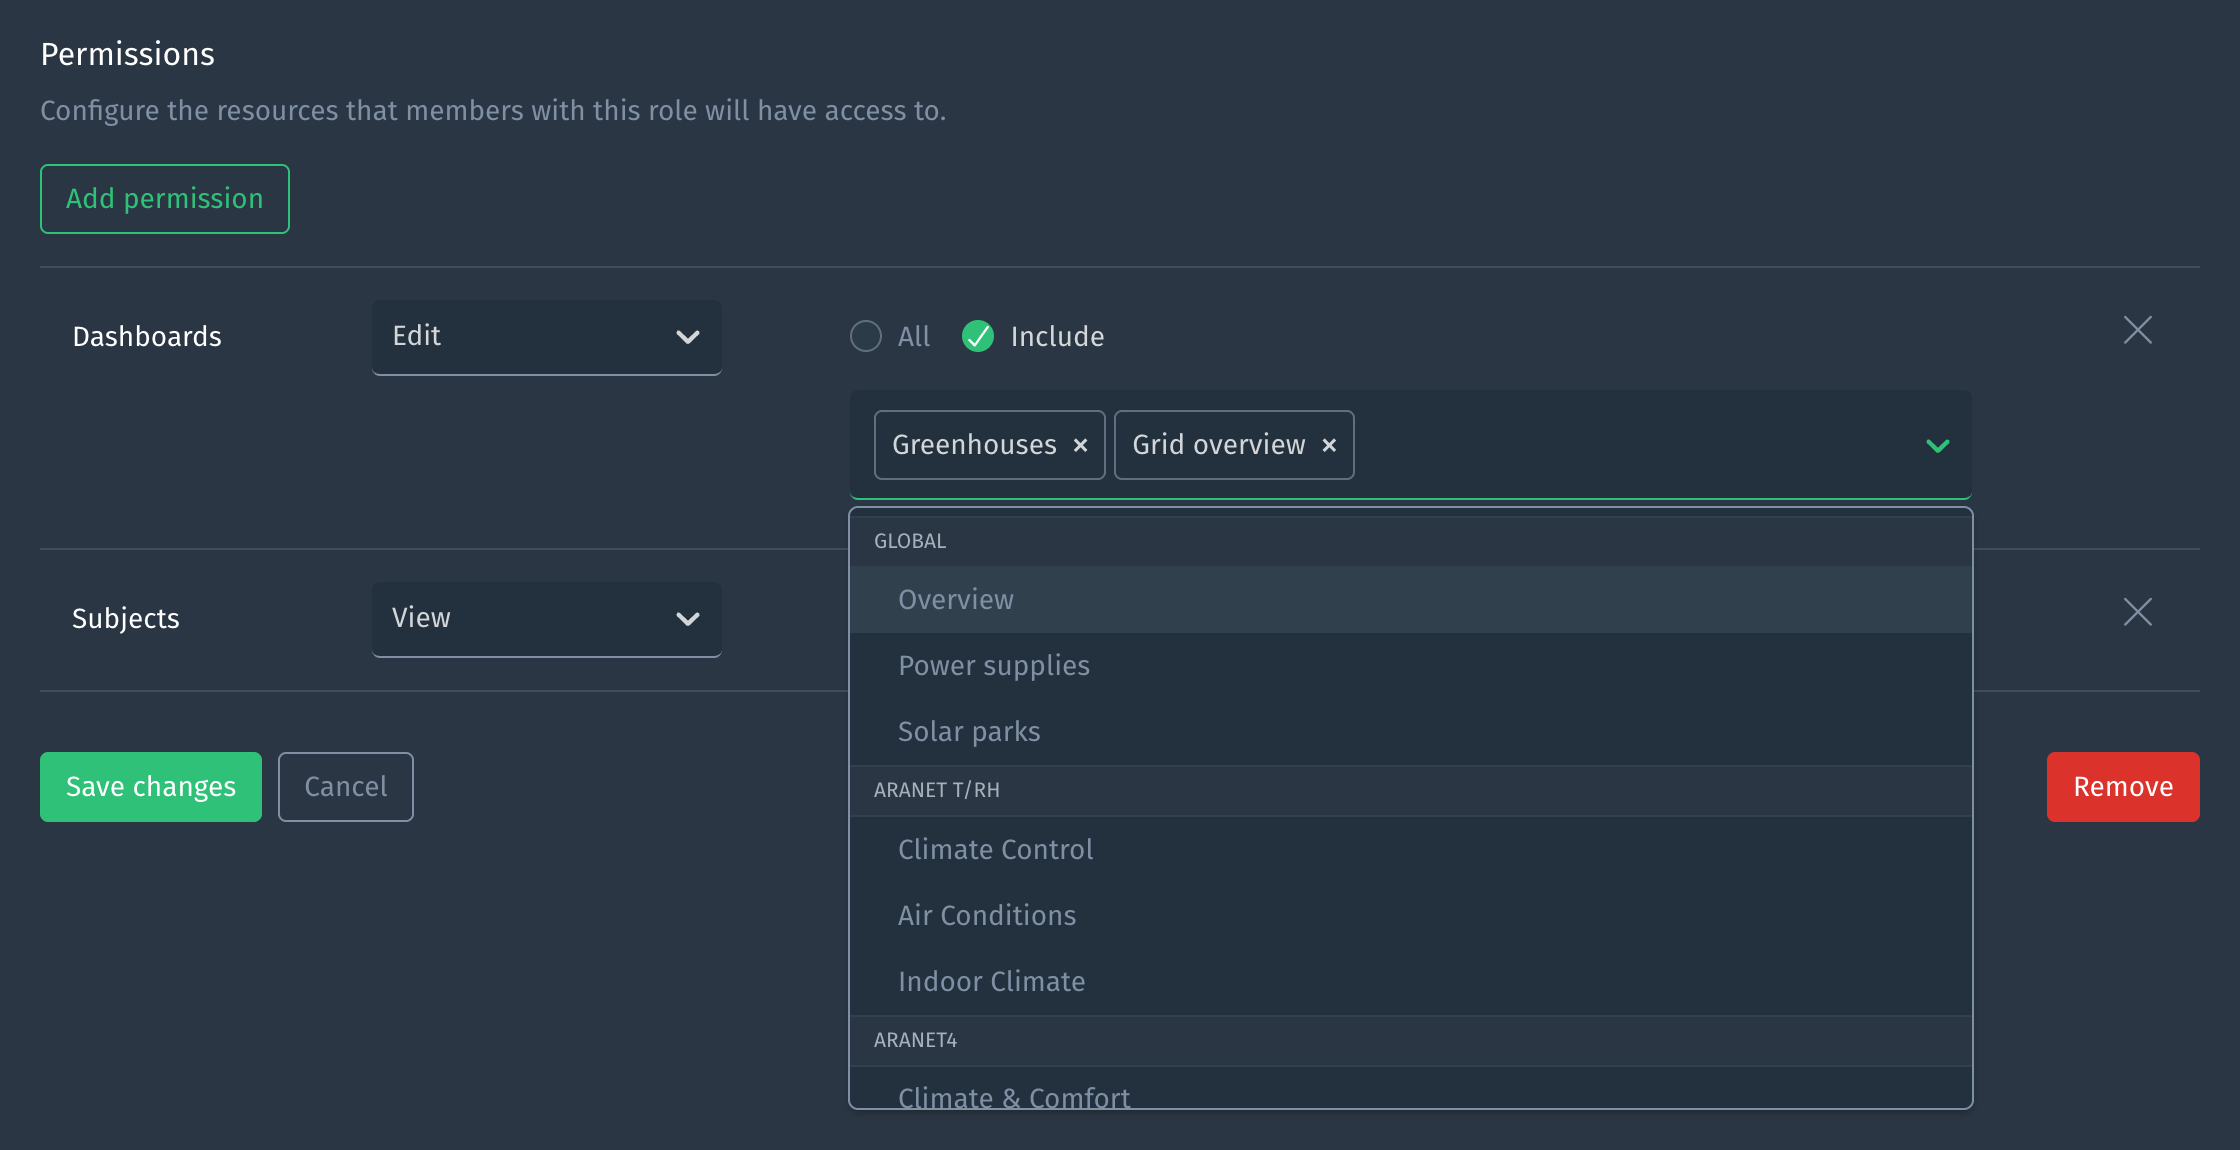
We’ve also introduced a new feature that lets you easily view which user roles have access to a particular dashboard. As an administrator, you’ll now see a convenient ‘user roles’ icon on each dashboard tab. Clicking on this icon opens a dialog that gives you a clear overview of the user roles defined in your project and their permissions for the current dashboard.

From this new dialog, you can also directly update the permissions each user role has for this dashboard. If you wish to make further adjustments to a user role’s permissions, you can click on the user role’s name, which will take you to the user role edit page.
Action advised
As communicated earlier via email, you may want to take action regarding the permissions that were converted as part of this release. To ensure that existing dashboard permissions were not elevated, the following changes were made: 1) dashboard view and edit permissions have been constrained accordingly and 2) manage permissions have been reduced to constrained edit permissions for all global dashboards. You might want to elevate these dashboard permissions again depending on your use case. Be aware that previously, dashboard permissions applied only to global dashboards, now they apply to all dashboards. Consequently, permissions which are not constrained to specific dashboards now apply to all dashboards (instead of only global dashboards).
Improvements
- Maps now load more smoothly, eliminating occasional multiple redraws on initial render.
- We’ve made it clearer when an authorization header is set for a webhook and now allow it to be cleared.
Fixes
- We fixed an issue where lines were not always assigned the same color in embedded charts.
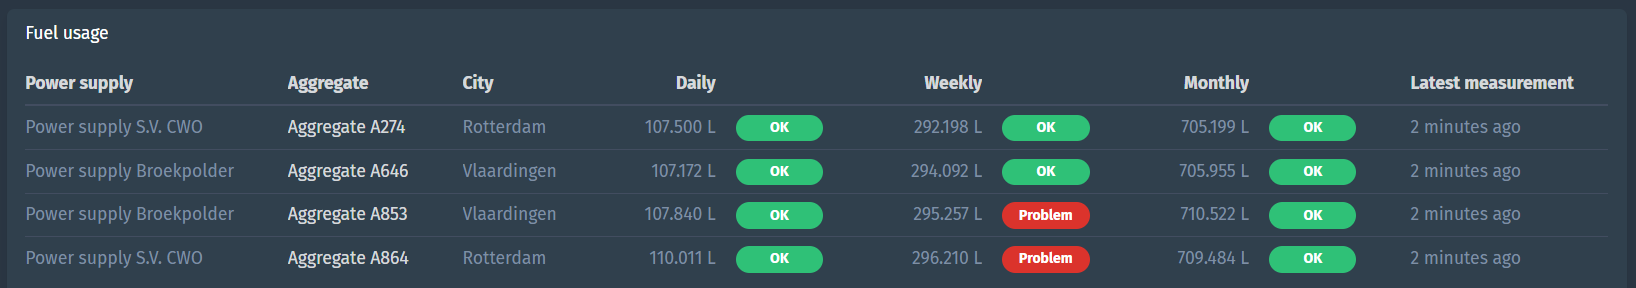
Aggregations in table widget
March 27, 2025
We’ve been enhancing the subject overview ever since we introduced the table widget. Now, we’re excited to announce the release of aggregations! With this powerful extension, you can effortlessly display average, minimum, maximum, sum of values, and number of measurements over any selected period on your dashboard. This is, for instance, excellent for showing your average power over one hour or the maximum power of last month. Furthermore, this allows you to aggregate over child subject measurements. For example, you can use this to show the average power generated for all turbines per section in your wind farm.
Support for LwM2M
The platform now supports Lightweight Machine-to-Machine (LwM2M) protocol, including a powerful ability to issue commands using actions. If the device is offline, commands are automatically queued until it is reconnected. This opens up a world of new opportunities for integrating resource-constrained devices. Imagine devices that need to be efficient in bidirectional communication because they run on batteries and need simplified messaging due to low bandwidth, especially when operating in remote areas. Ready to explore more? Check out our LwM2m documentation for all the details!
Improvements
- Add group-by functionality to explorer
- Allow hidden property selection in all widgets
- Up character limit for webhook URL to 2000 characters
- Prevent autofill of username and password by password manager in inbound connector
Fixes
- Fix gauge chart behavior when zero on the right side
- Only show ’edit subject button’ when user has edit permission
- Fix scale domain when using sum aggregation in charts
- Fix line color being inverted in embedded charts for some specific cases
Scrollable table widget
February 27, 2025
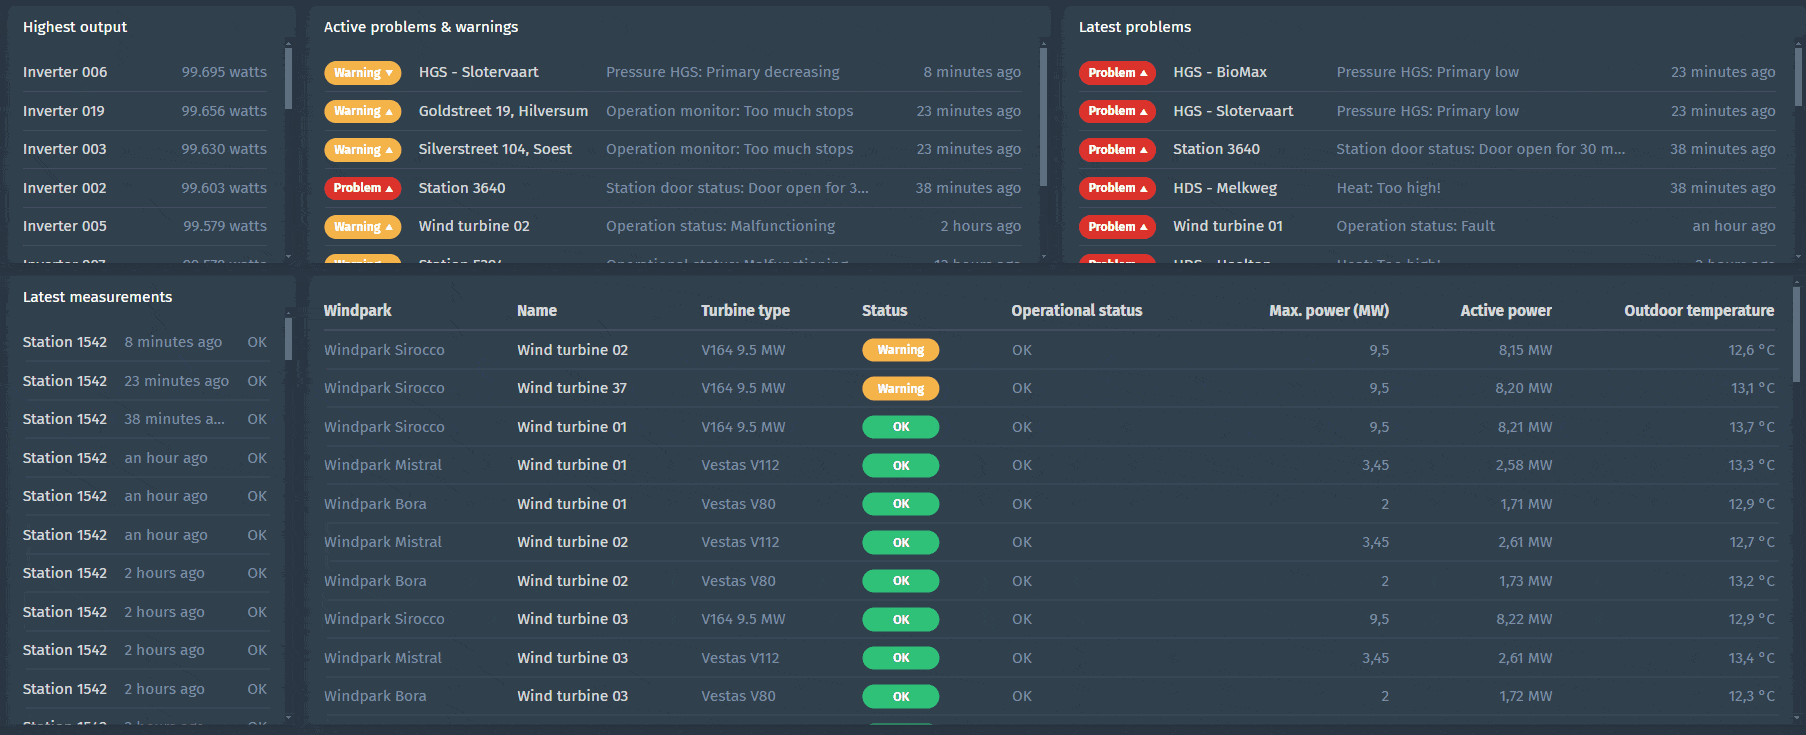
You can now see what is next! We made the table widget scrollable which gives you the possibility to keep the widget small on the dashboard and scroll in the widget to see up to 100 rows. In the enlarged view of the widget, you can now even scroll or page through all the data. A typical use case is to show a top five of subjects, measurements or events at glance but still be able to see more if you scroll in the widget. Here are some examples:
Clone event trigger condition
What we see often is the same trigger with different thresholds for another level, so we made it easy for you to clone a trigger.
Date functions in calculated metric
We’ve seen customer cases where triggering on a sum of production, consumption, fuel usage or any kind of metric per period is valuable. To enable this, we created date functions that simplify calculations per hour, day, week and month. These results can be used in triggers, graphs, tables and other visualizations.
We added the example calculation for monthly fuel usage to the docs.
Improvements
- Support for LwM2M protocol
- Use property values to configure dashboard widgets
- Thresholds in line and bar chart dashboard widgets
- Generate audit logs for dashboard changes
- Explicitly save dashboard after editing
- Filter out empty text measurements when using measurement filtering
- Make initial position in stream configurable when consuming from Azure Event Hub, Kafka or Amazon Kinesis in inbound connectors
- Support to upload a pem file without a password when using a custom config for trusted TLS/SSL certificate authorities in MQTT and Kafka inbound connectors
- Add support for custom Mapbox style URLs (experimental)
Fixes
- Fix lag when editing large dashboards
- Fix copy+paste between rich text dashboard widgets
- Limit selectable parent subject types only to applicable in Table widget’s subject overview data source
- Limit subject status to only event triggers you may view
- Prevent “enter” from closing dialogs
- Fix “floating” period toggle buttons
- Fix payload with array with
nullvalue not handled correctly - Fix scatter plot unexpected errors
- Fix subject labels when embedding charts
- Fix gauge chart threshold validation
- Speed up loading event triggers
Audit log
January 2, 2025
Happy new year! 🍾 We kick off 2025 with releasing audit log functionality to keep track of all important project activity over time. Using audit logs you will be able to reconstruct who did what when. This can help you troubleshoot issues and is fundamental for ensuring compliance with many industry regulations and standards.
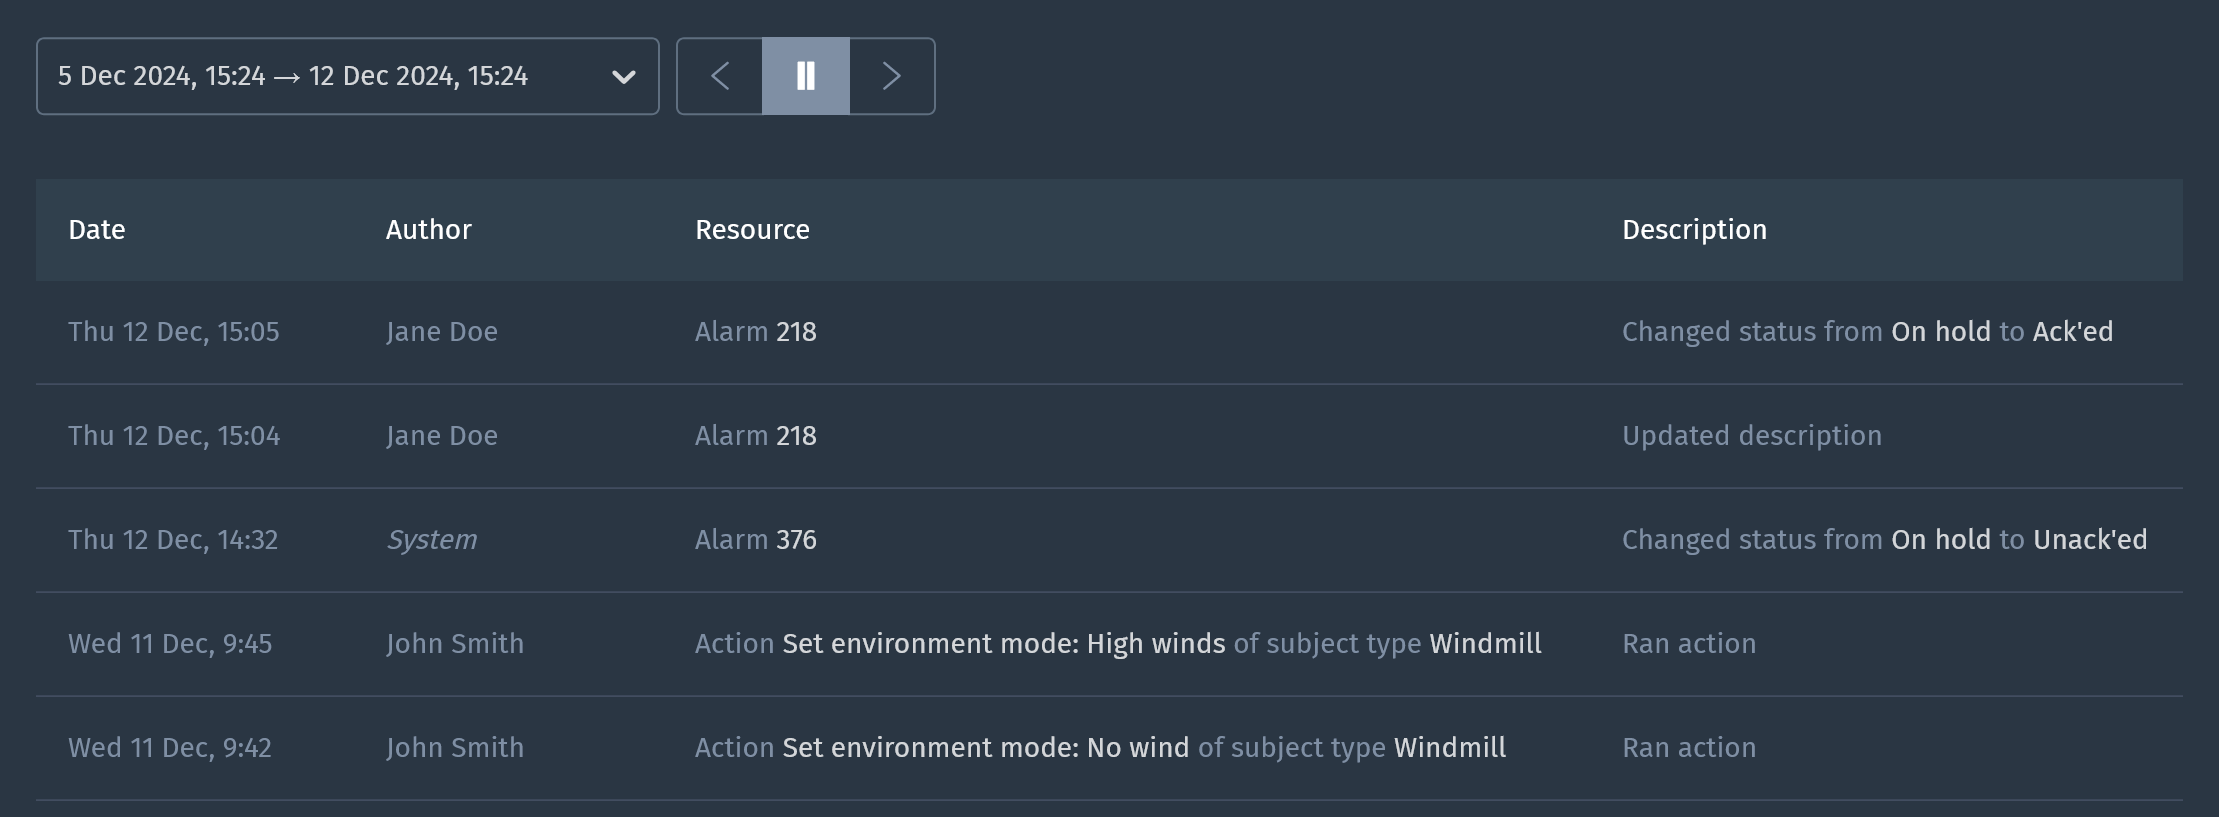
Audit log is only available to users on our Enterprise plan - contact us if you are interested in trying it out. For a full overview of the audit log functionality visit the docs.
Improvements
- Only copy raw payload when using copy action from payload log messages in inbound connectors to make reuse easier
Fixes
None
Suppressions
December 18, 2024
During periods of maintenance your asset’s condition-based health checks are expected to trigger, which consequently creates alarms and notifies users (or systems). These false alarms may lead to alarm fatigue and should be prevented. In order to easily do this, we are introducing functionality to temporarily suppress alarms and notifications.
With suppressions you can:
- Temporarily prevent alarms from being created
- Avoid other actions that result from an event, specifically notifications and webhook calls
- Specify which assets and event triggers should be suppressed and during which period
- Quickly add a suppression from a specific alarm
- Filter and sort suppressions by name, status, period, asset or event trigger
- Easily distinguish between active, scheduled or expired suppressions
Suppressions are only available to users on our Advanced and Enterprise plan - contact us if you are interested in trying it out. For a full overview of the suppressions functionality visit the docs.
Improvements
- Add new options in the Table widget’s subject overview data source
- Add event trigger filter option for the status column
- Add option for parent subject names as column
- Add various measurement filtering options for text and location metrics
- Add satellite view option to Map widget
- Add option to upload your own certificate chain to use as trust store for accepting TLS/SSL traffic in inbound connectors and outbound connectors (e.g. for using self-signed certificates)
- Add option to use client certificate without a password in inbound connectors which consume Kafka
- Add filter option for subject type in event trigger overview
- Add filter option for role in project member overview
- Share hover time with other embedded charts and hide play button when initiated with absolute period
Fixes
- Fix requiring a leading space before the
{to use parameters in a dashboard widget caption or rich text - Fix updating an existing parameter of a calculated metric or action
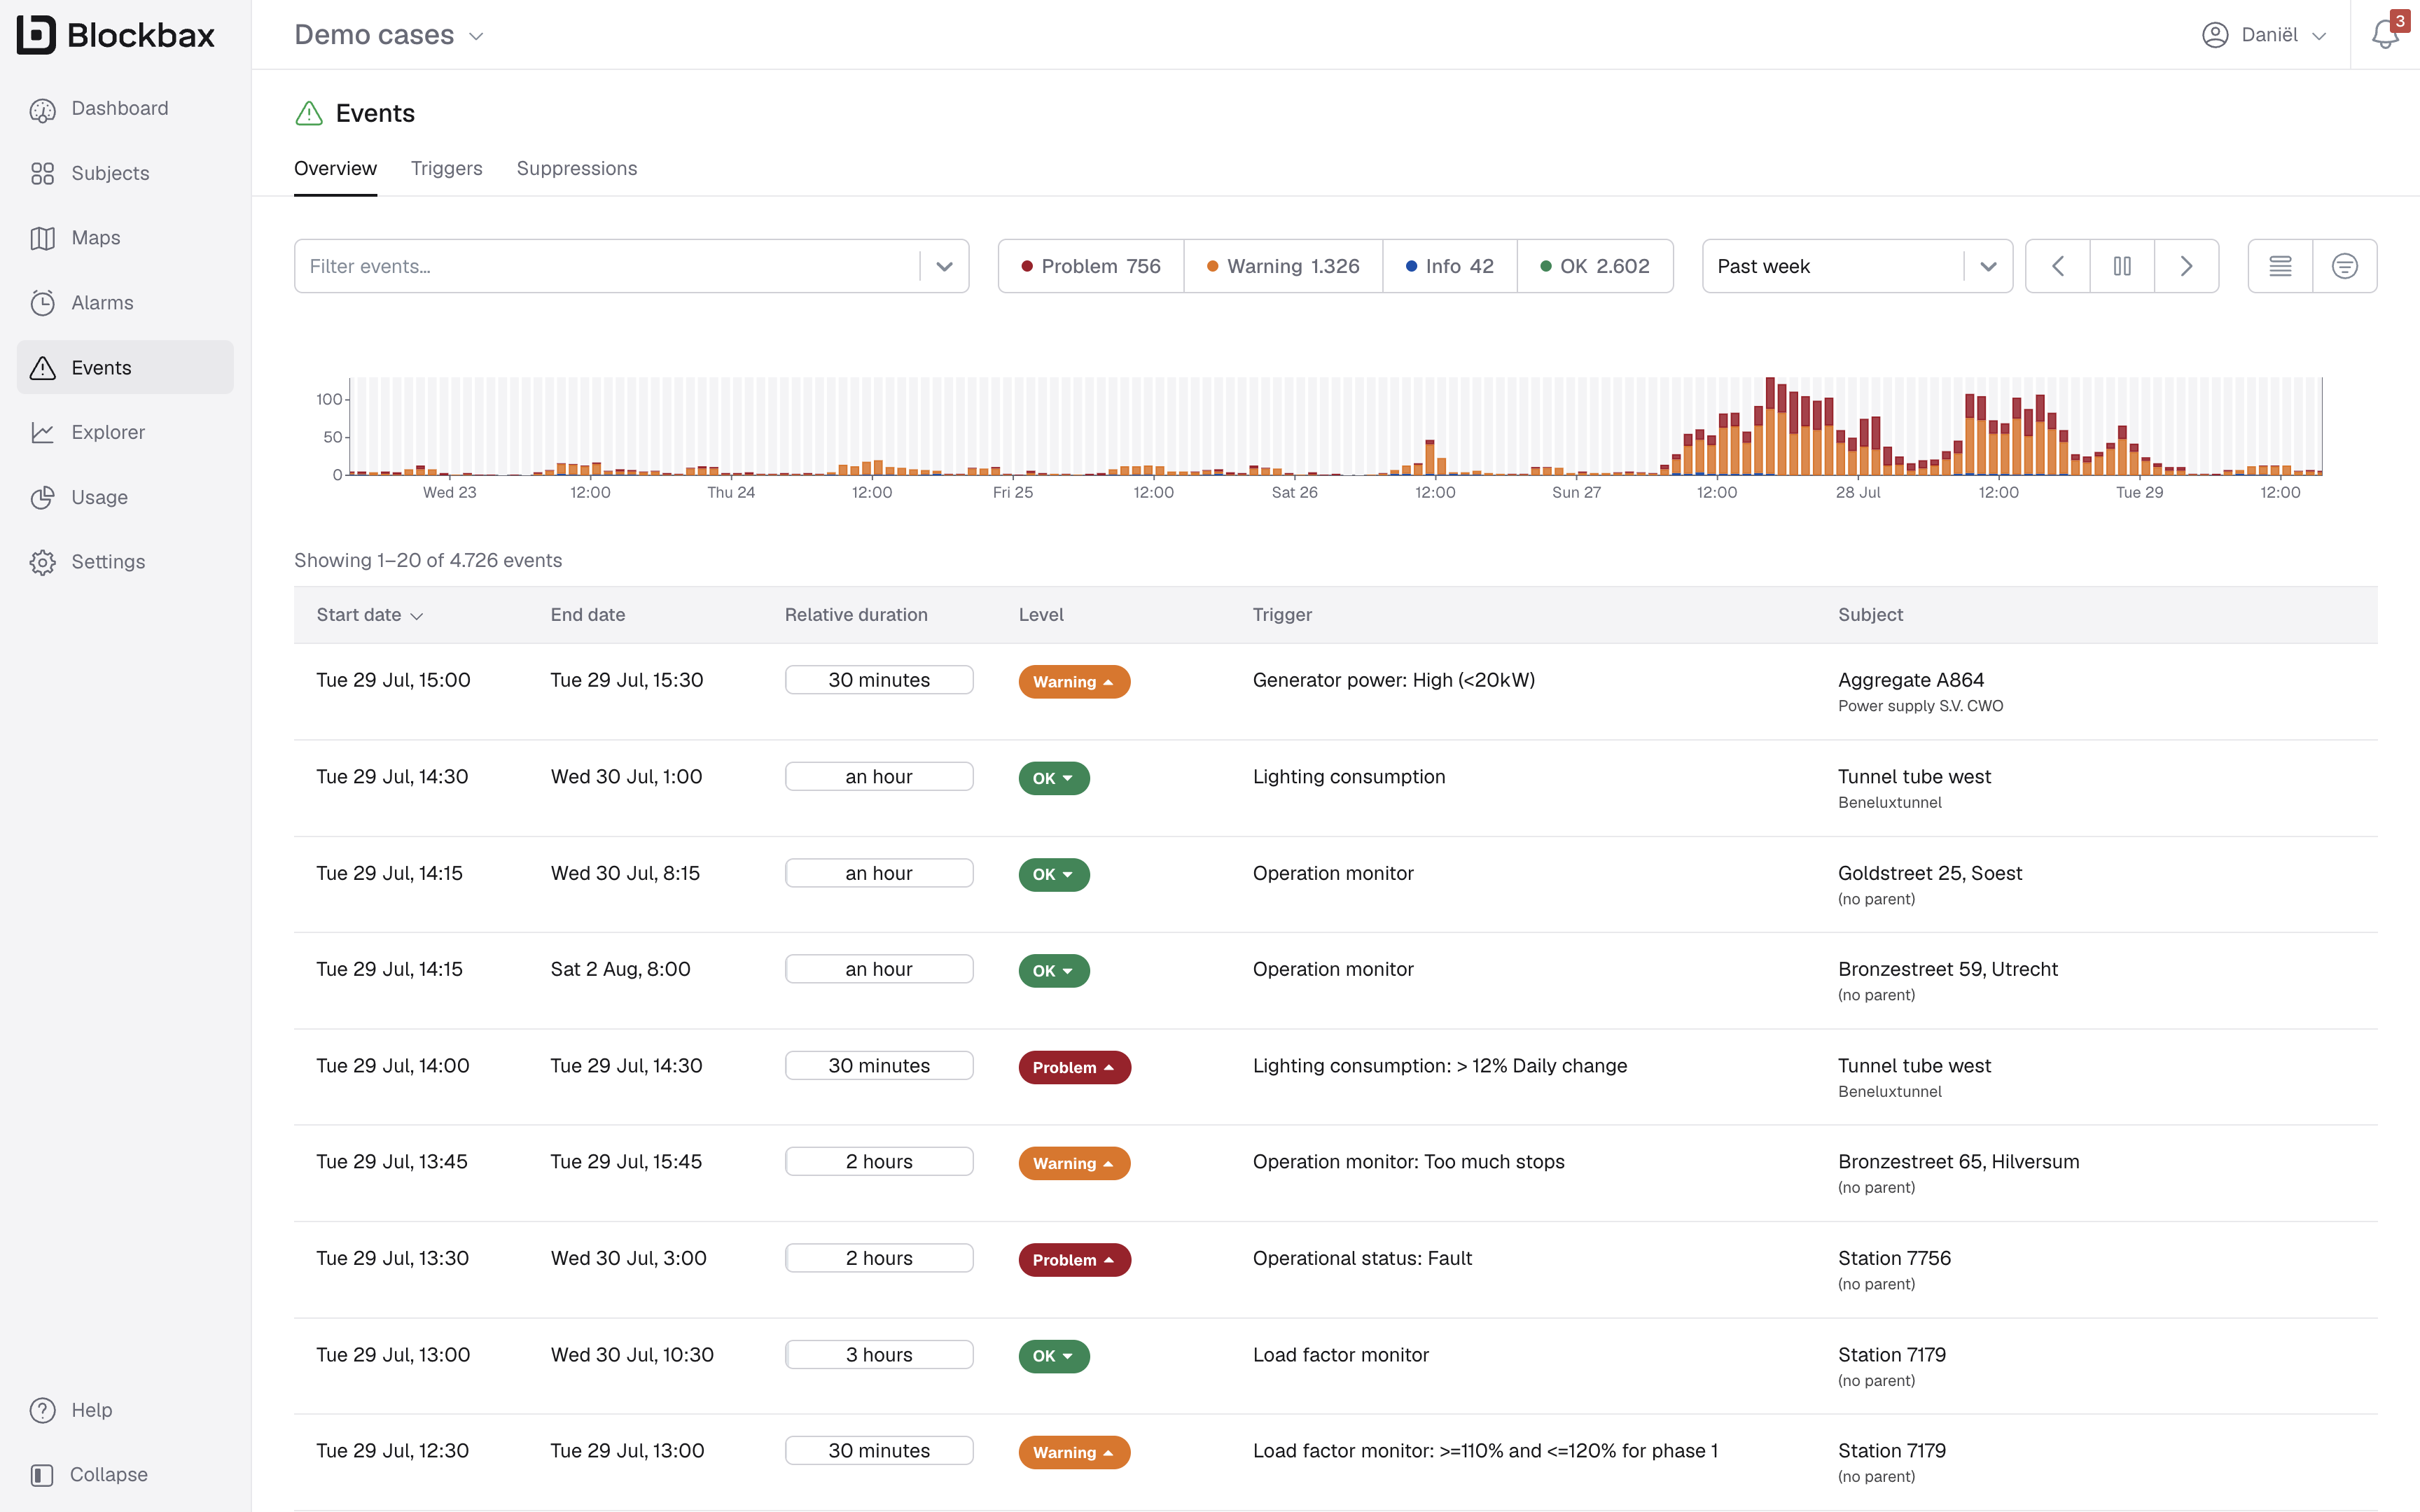
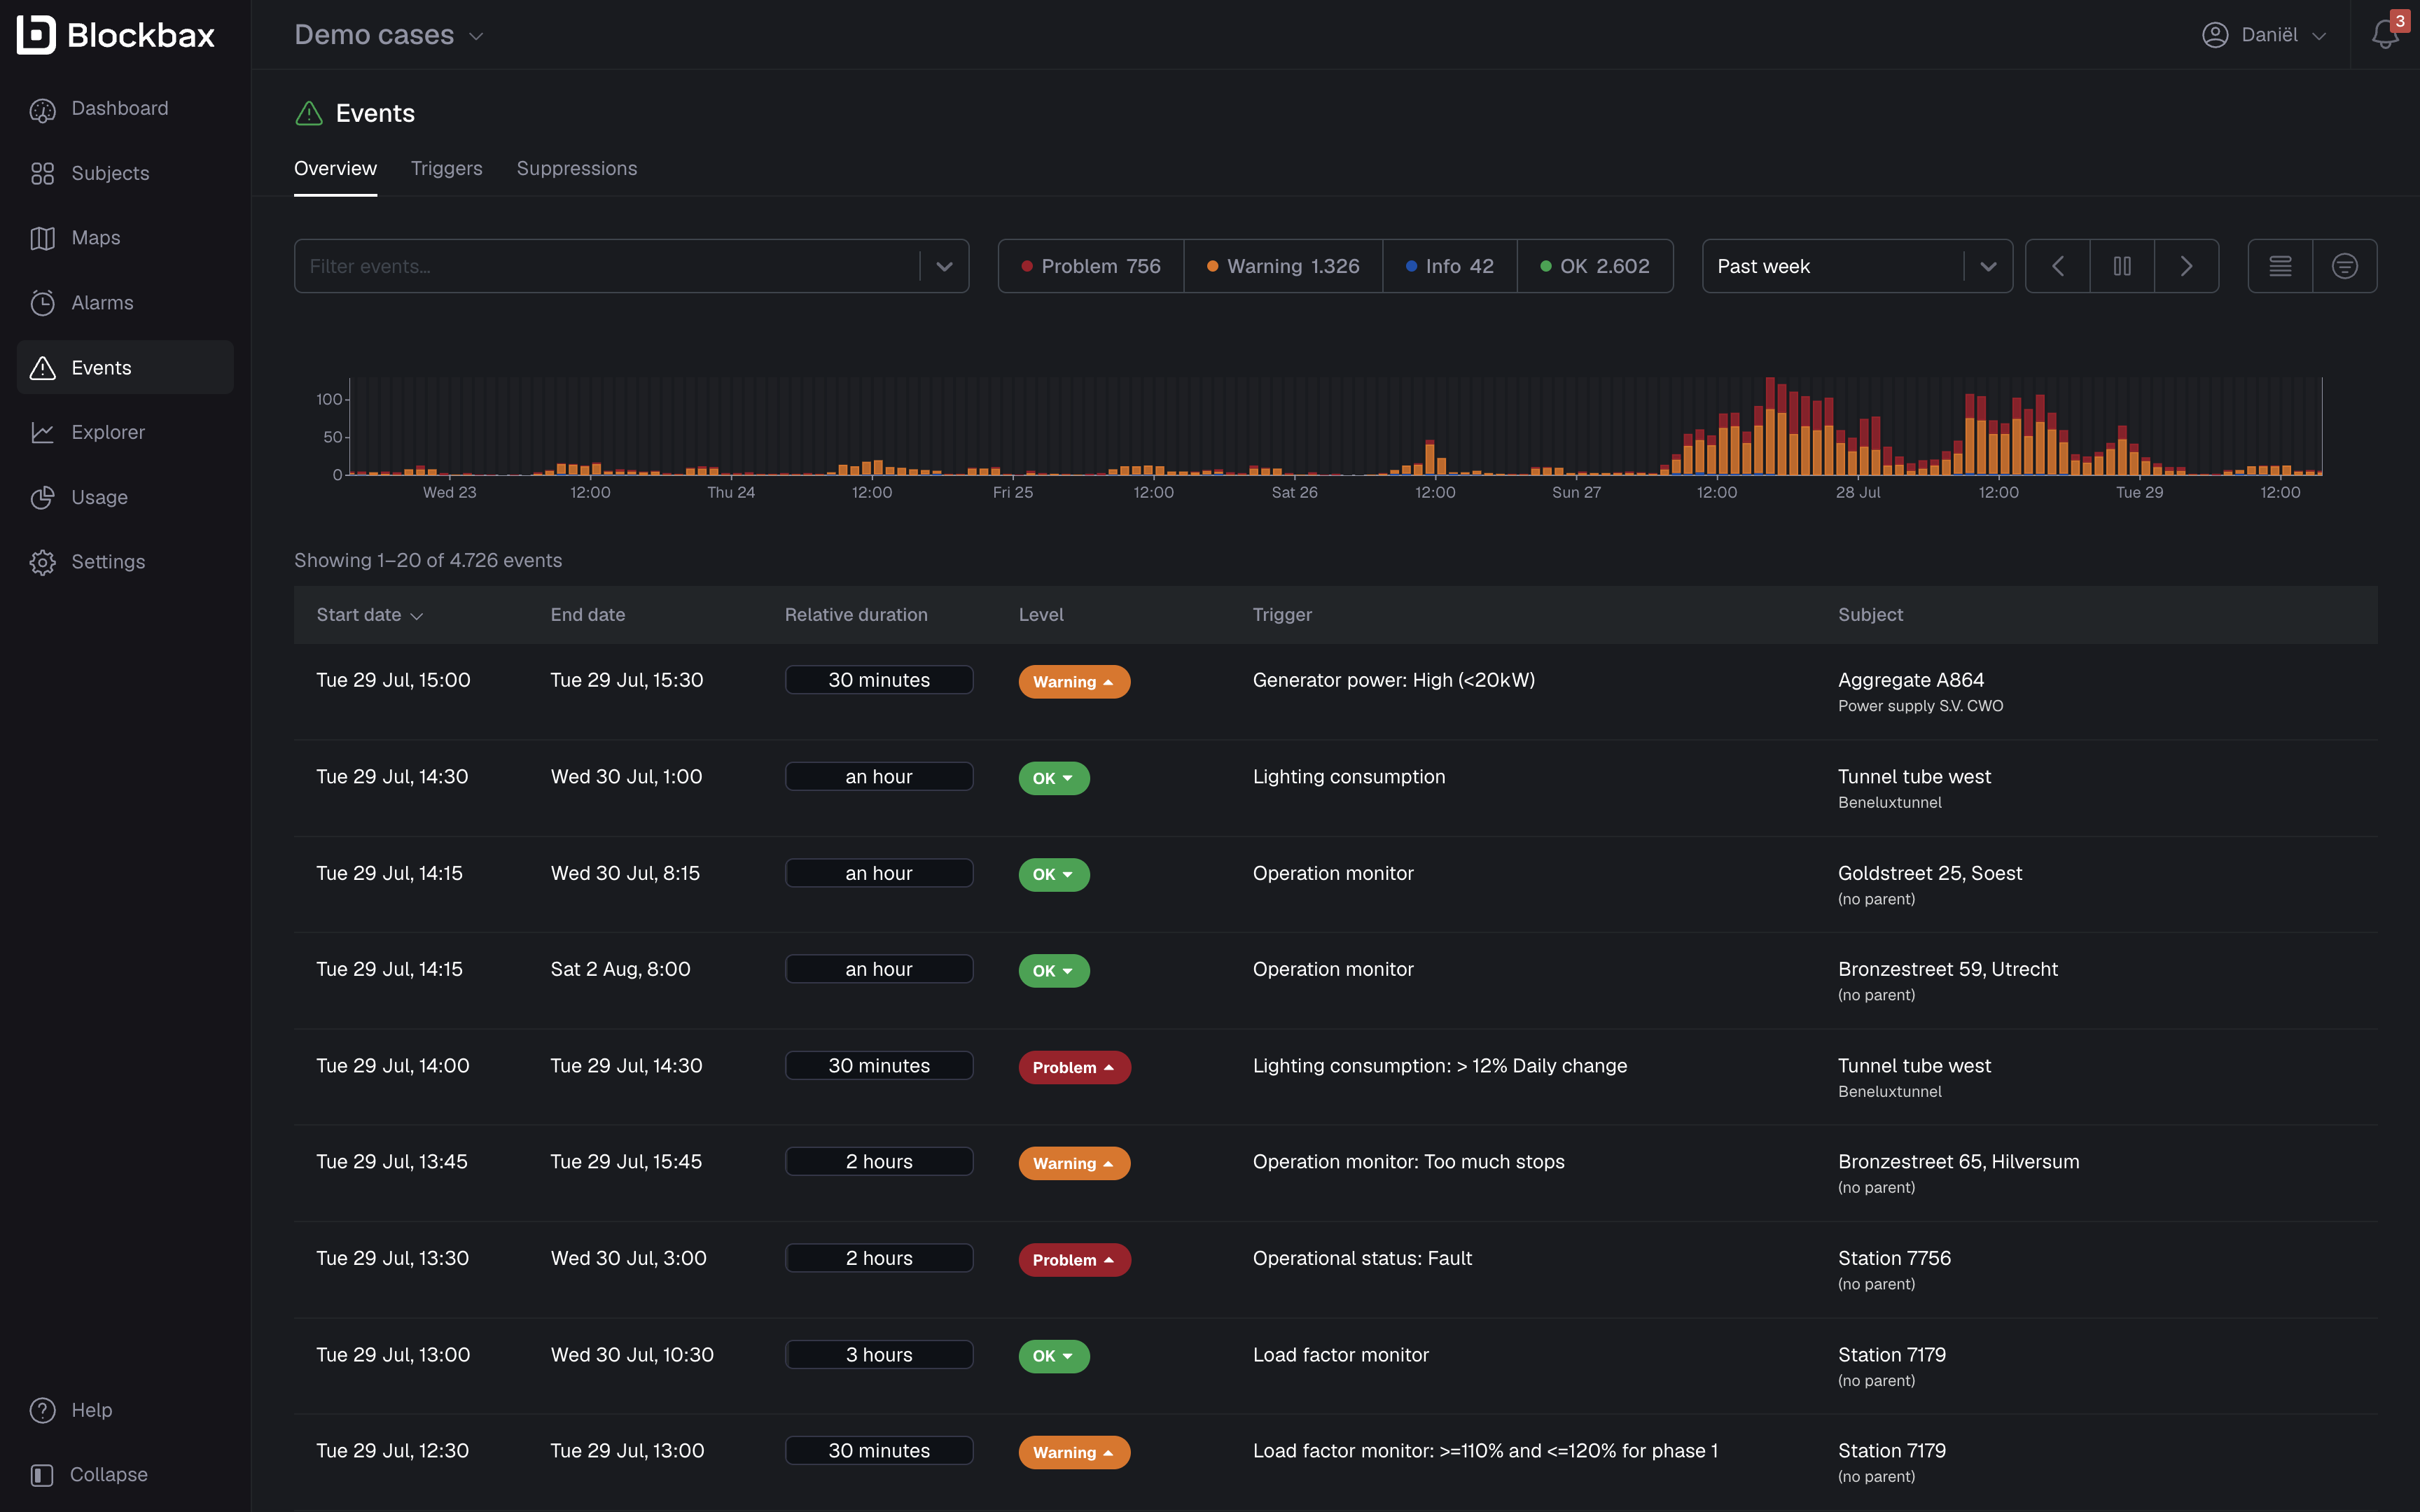
Alarm management
December 12, 2024
Now, you can follow up on events requiring attention directly from Blockbax. With our newly released alarm management functionality you can keep track and resolve alarms according to a structured, industry-standard workflow (following best practices from ISA-18.2 and IEC 62682).
We’ve built Alarms in Blockbax to be able to handle alarms from existing systems like SCADA and BMS, as well as alarms from Blockbax’s condition-based event triggers – providing a uniform approach to handling alarms. When alarms are scattered across different systems, it makes it difficult to improve operations. Because we aim to do just this – unlock the full potential of data-driven operations - we believe a uniform approach is key, allowing you to leverage our flexible rules to minimize false alarms and prevent alarm fatigue.
With Alarms you can:
- Move alarms through workflow stages (unacked, acked and closed)
- Temporarily put alarms on hold and get notified after specified time
- Easily get the right information and context about the related asset
- View which changes are made on the alarm by different users
- Filter and sort alarms by status, priority and asset
- Use quick actions to automatically resolve an alarm once inactive or suppress it
Alarm management is only available to users on our Advanced and Enterprise plan - contact us if you are interested in trying it out. For a full overview of the alarm management functionality visit the docs.
Improvements
- Add external ID of parent to the information available to an action
- Add option for existing account to switch to SAML for logging in
- Skip email verification for project invite initiated registration
- Allow password resets with no verified email
Fixes
- Fully allow a subject PUT based on the GET result
- Fix form submit on enter
- Fix project or role deletes failing when a role is used as default role in SSO settings
- Speed up page loads for roles, status and event statistics
- Fix bug when changing aggregation function in heatmap
- Fix last known location not visible when no measurements
What's new
October 17, 2024
We are introducing a changelog to inform you about what’s new in the platform. At Blockbax we are continuously improving and expanding our platform and want to make sure our users are up to speed with the latest developments. When we release fixes, improvements and exciting new features, we will be sure to let you know through this channel.
It is accessible right from the comfort of the web app. Keep an eye out for the icon on the bottom left!

Improvements
- Add latest measurement date as column type in table widget
- Add ability to search by address when selecting locations
- Add ability to quickly log payloads in inbound connector
- Show inbound connector connection type in grid
Fixes
- Fix bug when searching on subject ID in subject overview
- Fix empty page when adding graph from explorer