July 30, 2019 · 4 min read
Blockbax Platform highlights: The first of a series
We love fast data, but we also love fast and frequent releases. New features are added daily, and this blog series will showcase our favorite new features. This is the first blog in the series, so we will walk you through new features as well as some existing killer features. This blog’s highlights:
- Who let the docs out
- Configurable real-time event triggers
- Event notifications
- Interactive charts
- Integrations
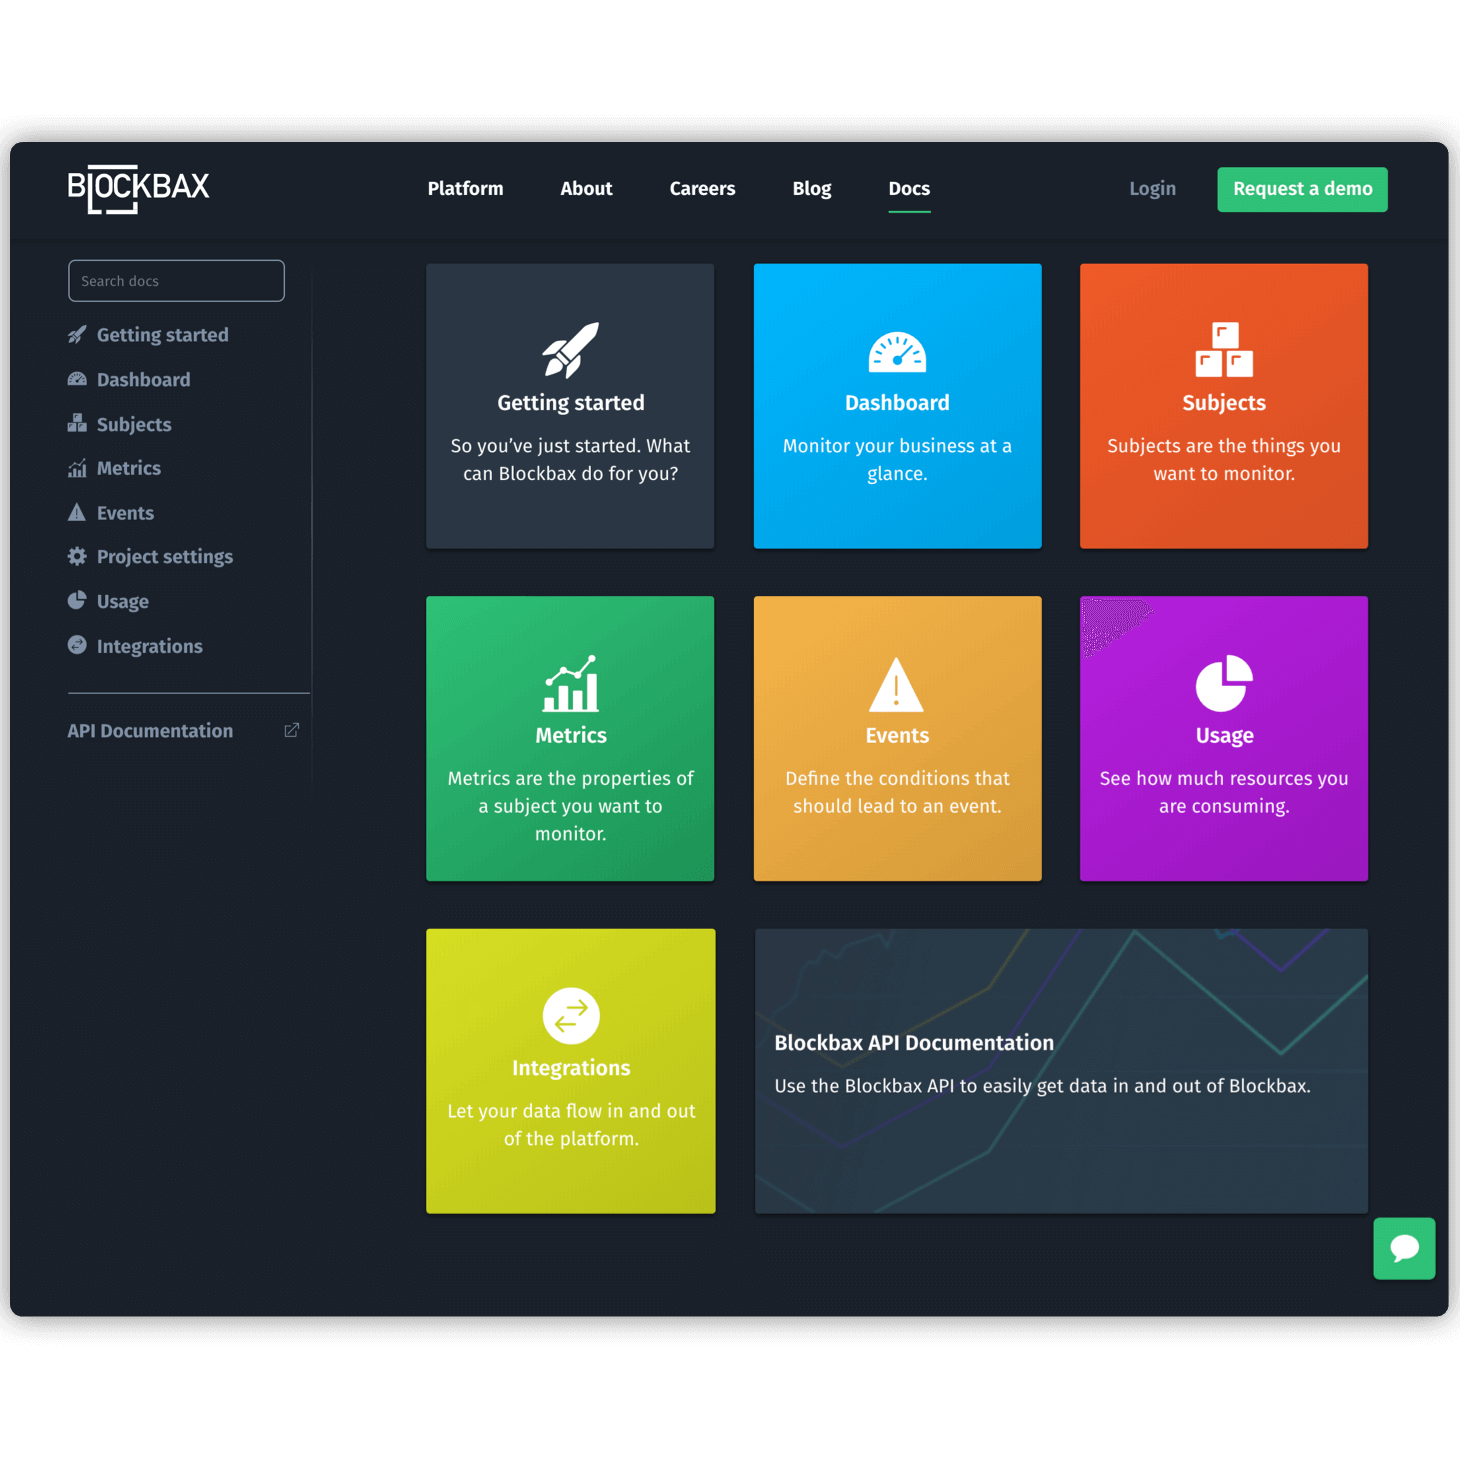
Who let the docs out
It might not be a platform feature, but we are very happy to have our platform docs released. This is a great starting point for developers and Blockbax users. The platform docs shows how to use the many features that are available and gets you started within no time. The API docs consists of searchable technical specifications and examples of how to use our HTTP API. Now that it is online, search engine crawlers have picked it up and you can also use Google if you have questions.
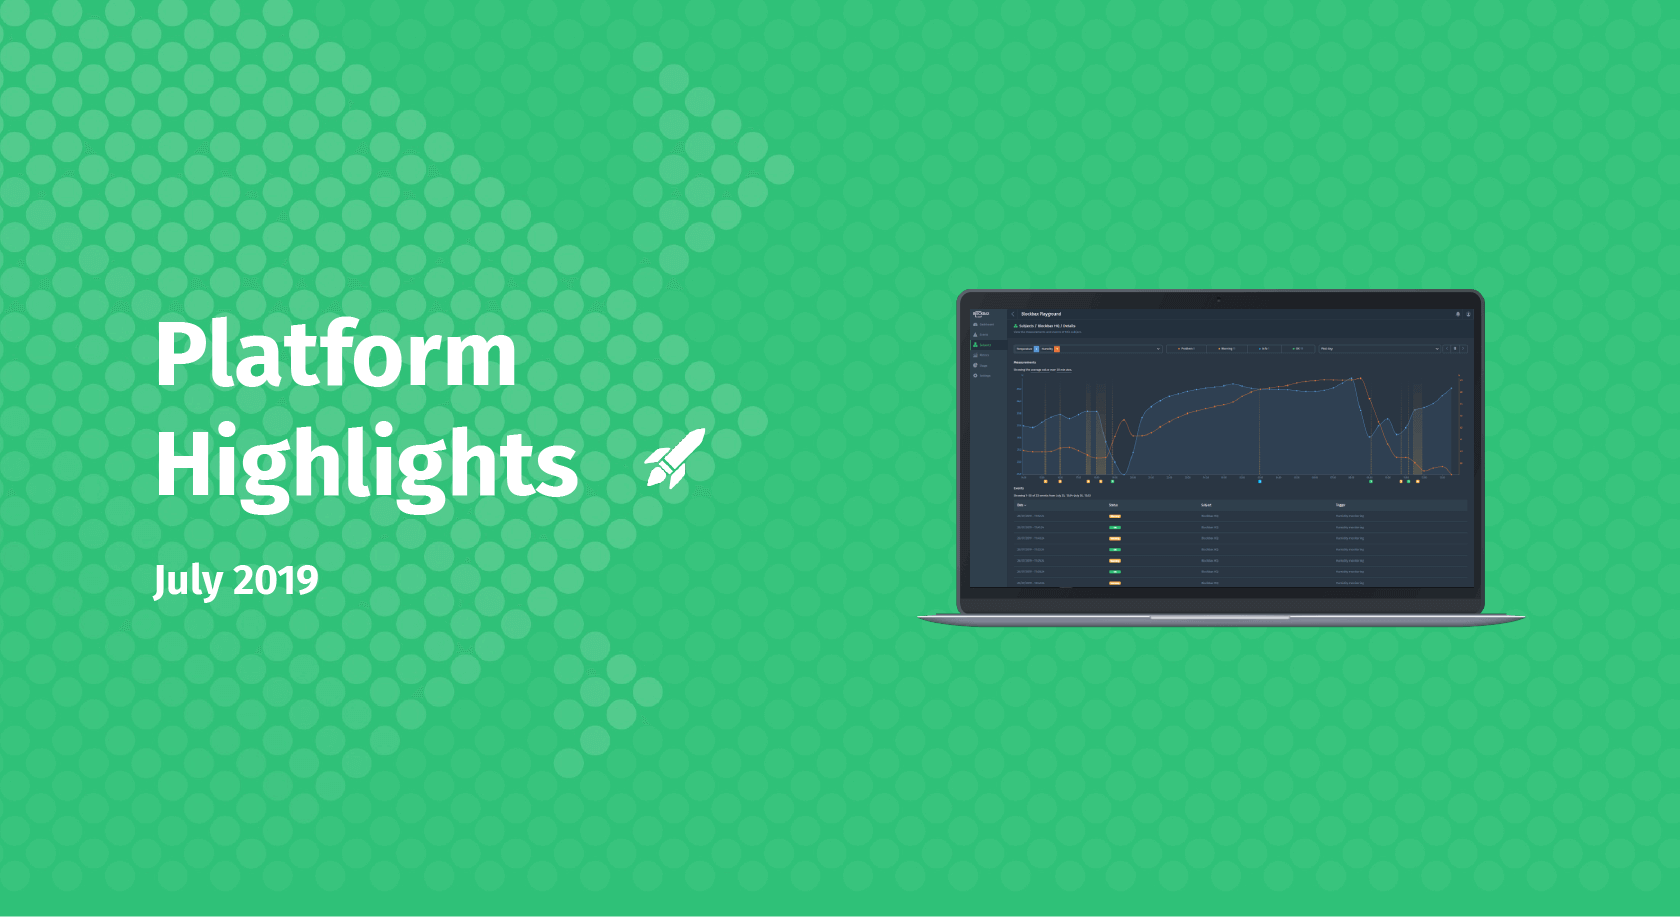
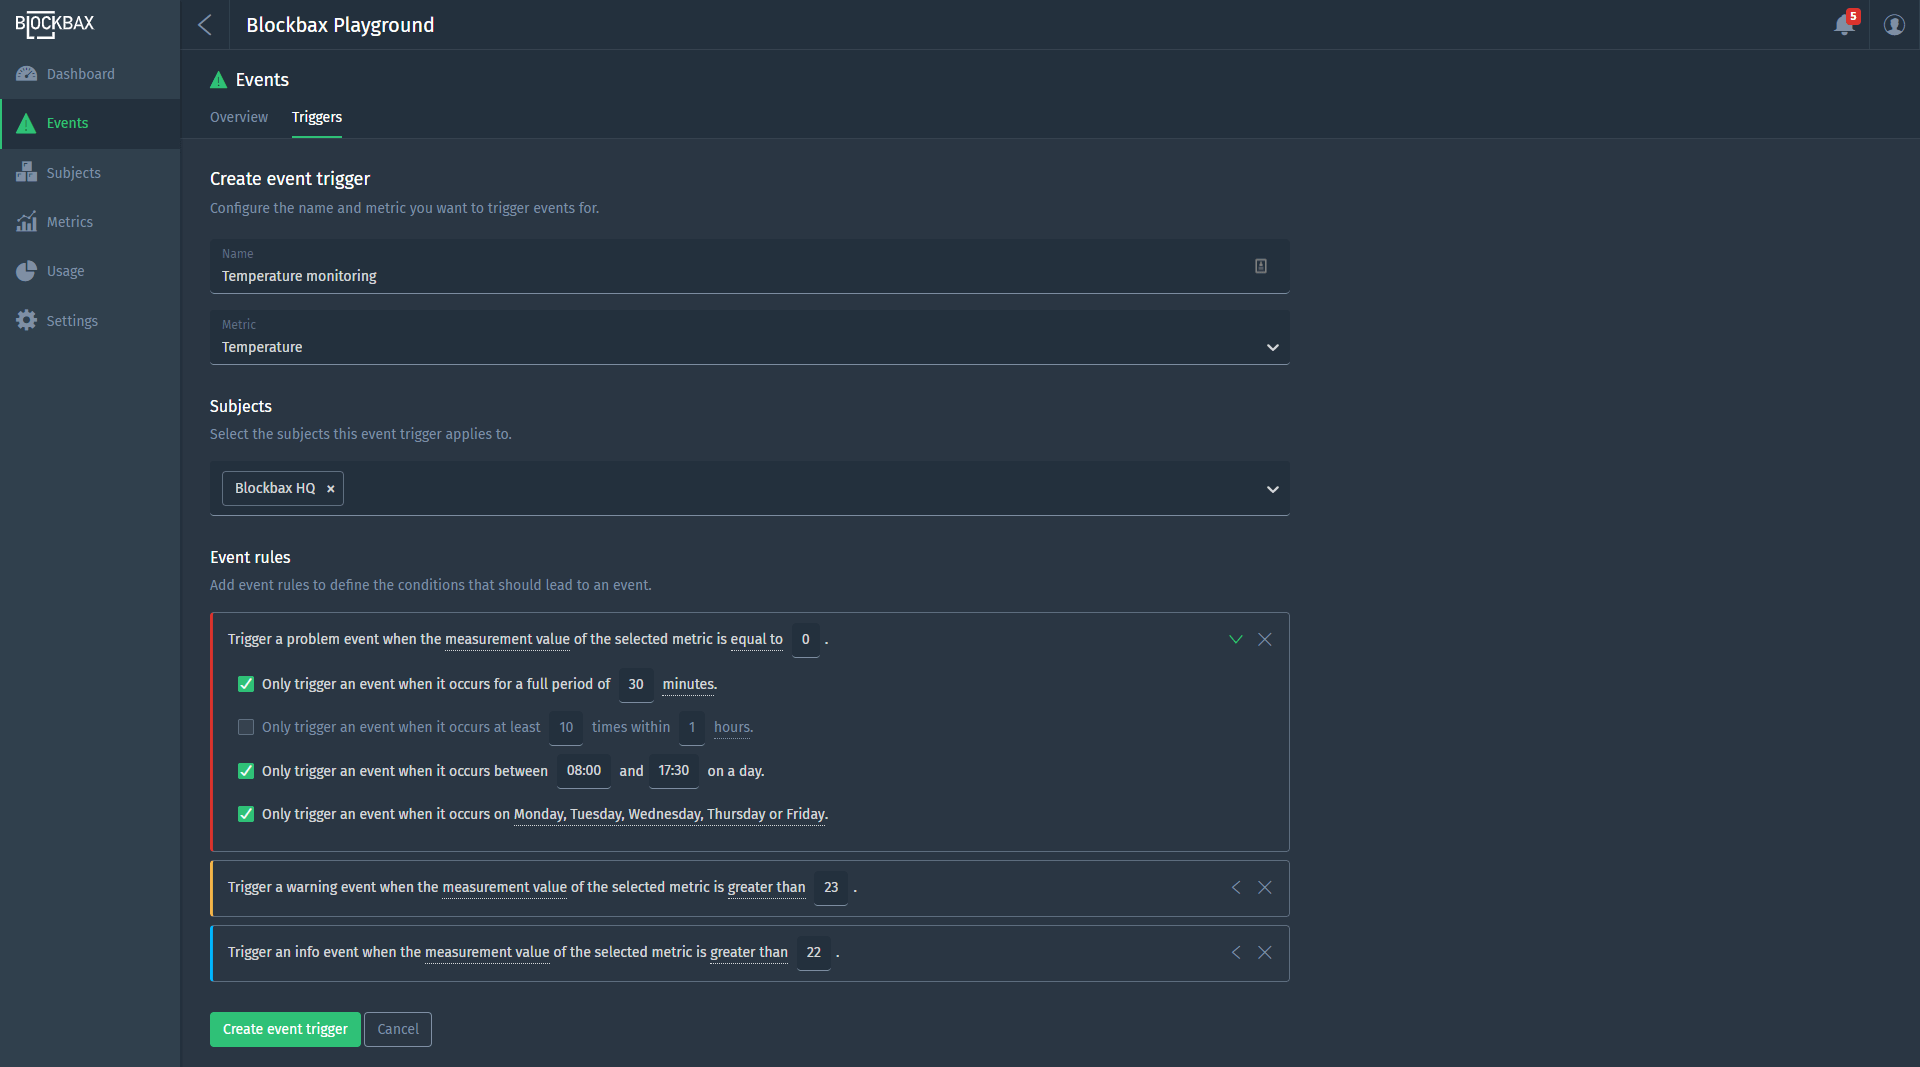
Configurable real-time event triggers
We created a user-friendly interface to configure triggers that generate events based on patterns present on incoming data. For example: you want to get a warning event when the temperature of a room is above 23 degrees for a period of at least half an hour. Events can have different levels based on priority. There are several possibilities to constrain your trigger on occurrence and time. Check out all the capabilities at our events docs.
Event notifications
Users can be notified in the web app, via e-mail, or via mobile push notifications when events happen. Notification settings can be customized to your liking: you can receive notifications for events of specific levels, and this can even be customized on a per-subject basis. A click on the notification brings you to the detail page with more event information. This page shows you the exact reason and point in time where the event was triggered, as well as surrounding measurements for the subject metric to provide context. Check out all the possibilities at our notification docs.
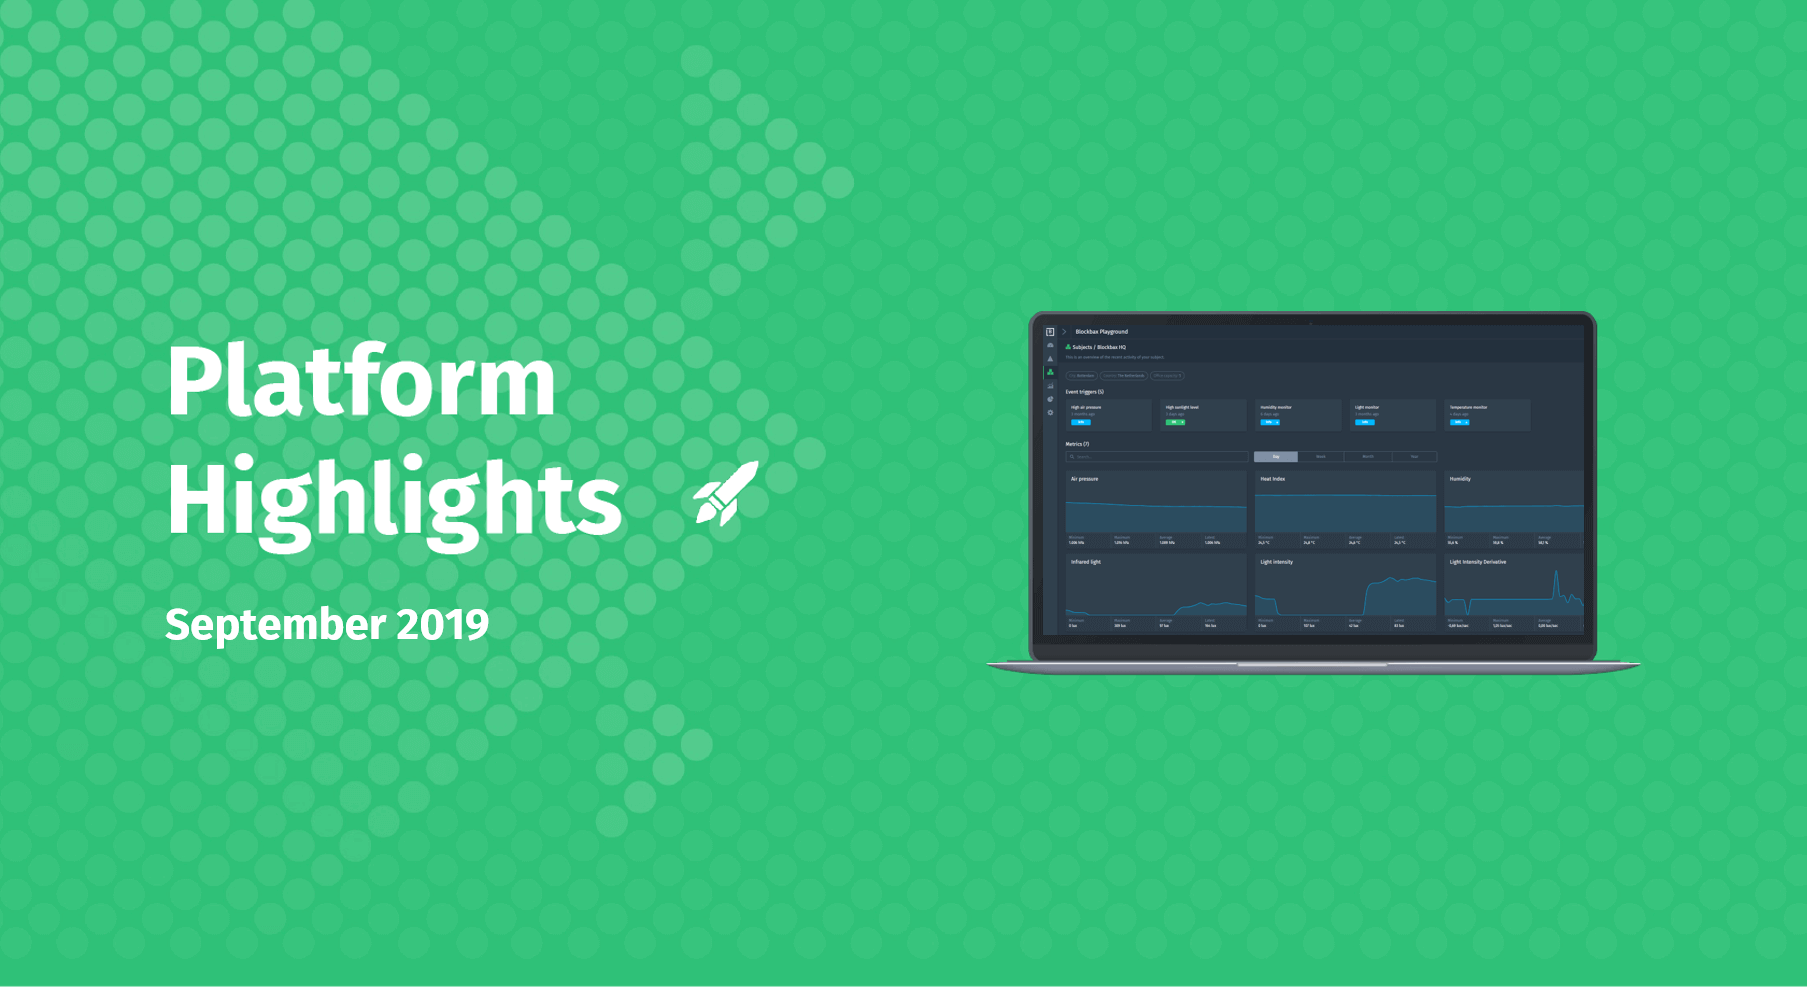
Interactive charts
We believe metric detail charts are an important tool to explore and analyze your data, and therefore we have made many improvements to these charts:
Multi-metric comparison. Comparison of different metrics within a subject by displaying them in the same chart.
Convenient date selector. A convenient date selector allows you to see the past hour, week, day, month or year of data. Of course an arbitrary range can still be provided as well.
Logical aggregation. Aggregate your data over logical periods. Logical periods are automatically determined for the selected time period.
Events emphasized. Events are shown and filtered on the timeline. You can filter your view based on the different event levels and time periods.
Real-time updates. The graphs update in real-time when new data and events are coming in!
Our metric docs provide a closer look into the interactive charts.
Integrations
You can use our MQTT integration which allows streaming your data to Blockbax. MQTT is a very reliable, lightweight protocol with a small code and network bandwidth footprint. All you need to get started with this integration is an access token and an MQTT client of your choosing.
Finally, in order to link events to immediate actions it is now possible to configure webhooks. A webhook pushes event information to your endpoint as soon as they happen. Of course it is possible to filter which event information is sent based on event levels, subjects, and metrics as you are used from us.
Enjoy using all these cool new features!
Cheers,
The Blockbax Team.