December 17, 2019 · 4 min read
Blockbax Platform highlights
We 💚 fast data, but we also love fast and frequent releases. New features are added daily, and this blog series will showcase our favorite new features. This blog’s highlights:
- Calculated metric release
- Enriched event overview
- Extended usage monitoring
- More extensive filter options
- Pro-tip: specify live period
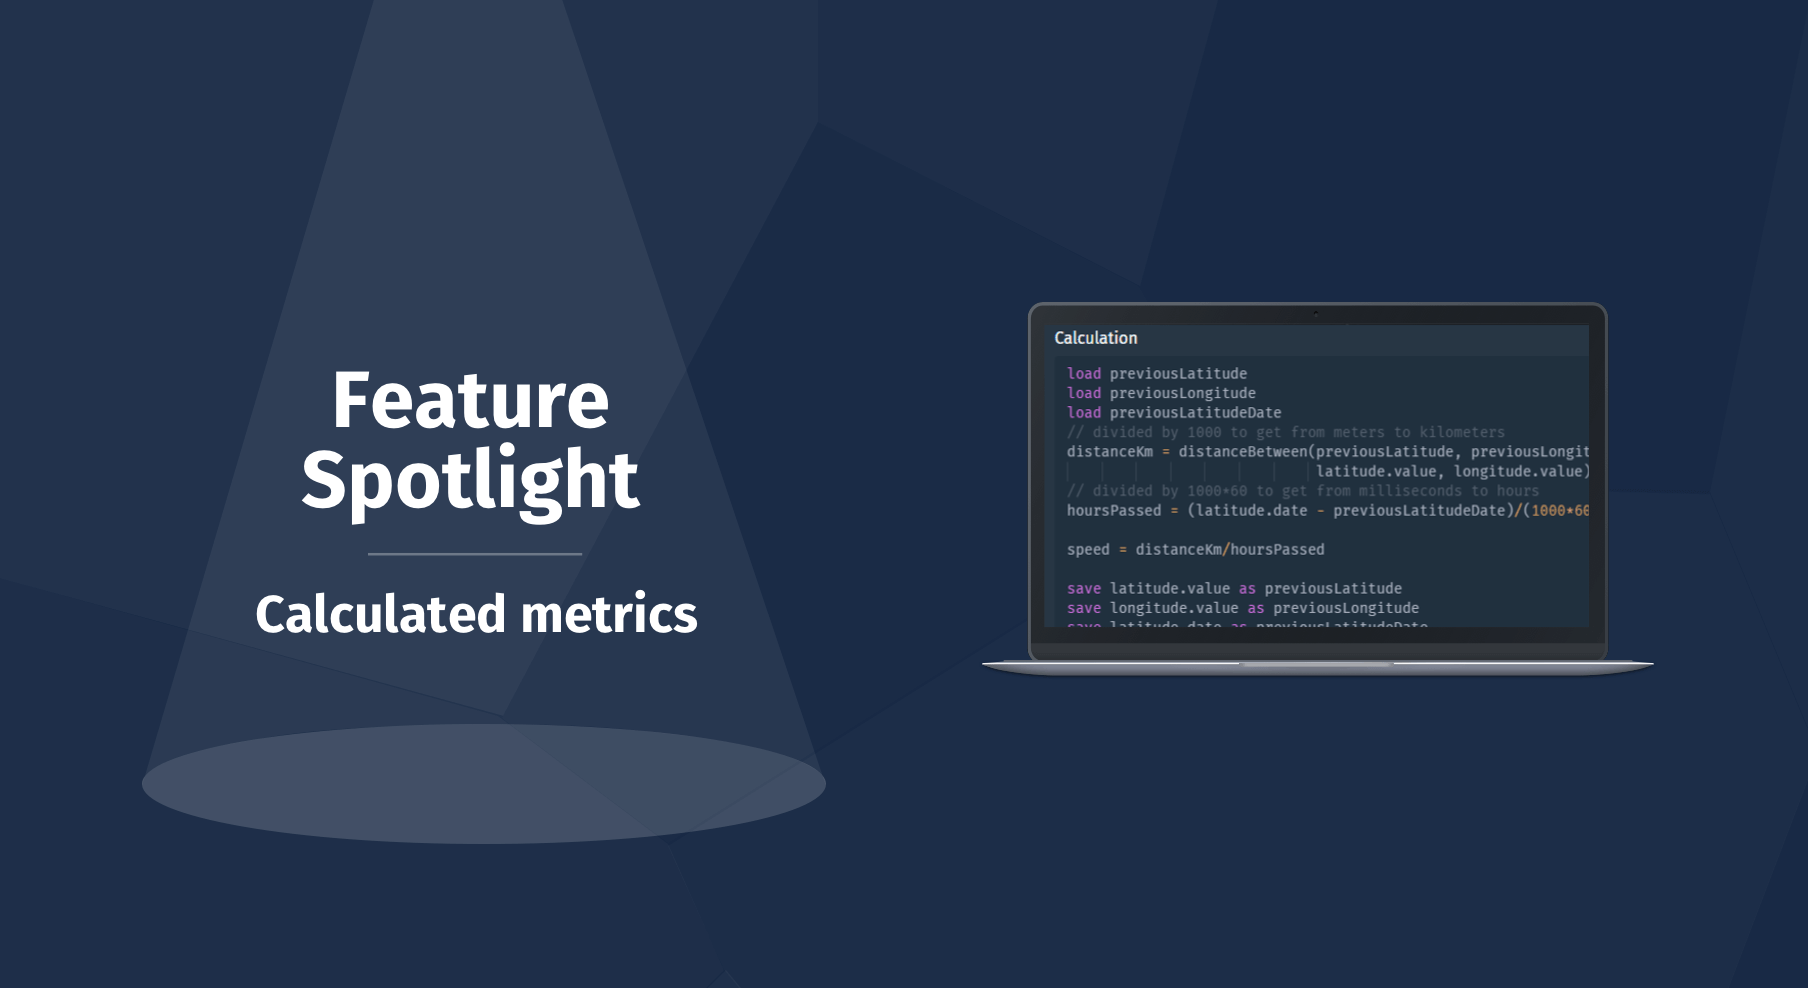
Calculated metric release
We released a feature spotlight blog about calculated metrics, but we would like to introduce this powerful new feature here as well.
A calculated metric produces measurements based on a calculation with values of a numeric property and/or one or more other metric measurements within a subject. Our own user-friendly language makes it convenient to create a calculation in the editor with some cool features.
The docs for calculated metics are extensive, but we would like to give some special attention to the computations that are available as functions. These functions together with the arithmetic operations bring the power to calculate the distance between two locations, the derivative of a ingested metric or any other calculation that needs to be done.
The example down here calculates the simplified heat index with the last known temperature measurement when the humidity measurement is received and with a humidity measurement not older than 10 seconds when a temperature measurement is received.
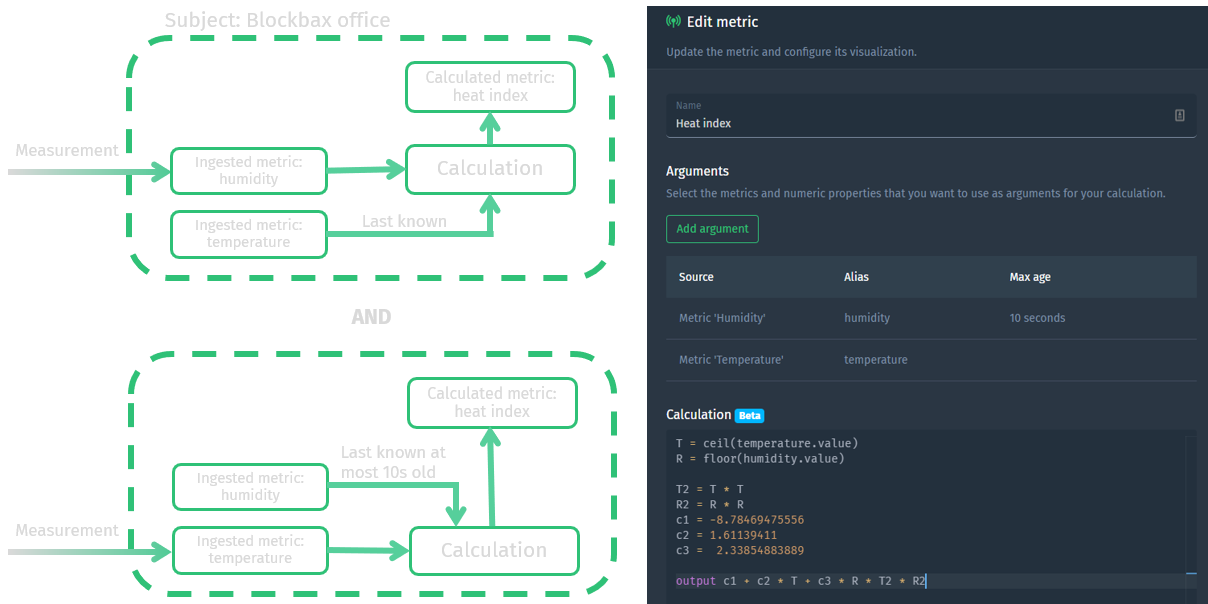
The docs have more calculated metric examples listed.
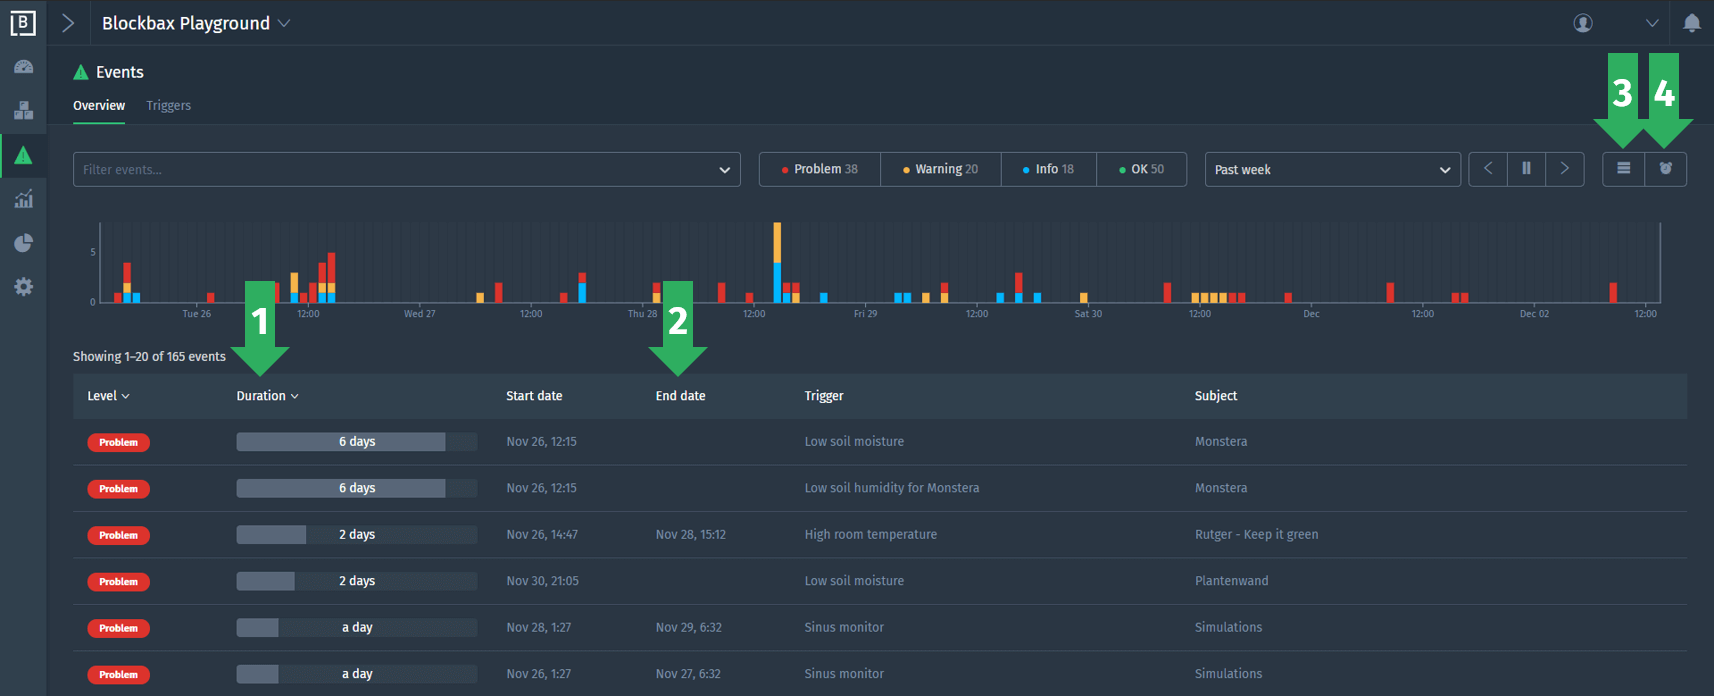
Enriched event overview
We did four improvements to enrich the info of an event in the overview. First of all, the duration (1) and end date (2) are added to the overview. Second, you can toggle a button (3) to see grouped events. This button will group the events by the number of times they occurred based on the selected period. Last, you can toggle a button (4) to see the active events. A click on this button will give you an instant view on the events that are still running (e.g. events without end date). More info can be found in the event documentation.
Extended usage monitoring
The number of series that are ‘in use’ are now visible in the usage overview. A series is a unique metric and subject combination, like the power usage of a specific machine. A series is considered ‘in use’ from the moment the first measurement is produced until the related subject or metric gets deleted. The usage documentation is also updated to stay clear and transparent about the amount of data that is flowing through the platform.
More extensive filter options
It is now also possible to use properties to search for subjects and events. We chose a property-based model and avoid hierarchies, because most real-world data can not be mapped to strict hierarchies. A property-based model is ideally suited to make all kinds of cross sections of your data. For example, you might want to see all machines of a certain brand and type in a specific area of the world which are in a problem state.
Pro-tip: specify live period
As you might now, the graphs are live updated based on the selected period. Several default relative periods can be selected, like the past 15 minutes and the past hour. But, it is also possible to define your own live period. Select a period, double click the time axis and unfreeze the period:
Enjoy using all these cool new features! And stay tuned for blog specials about calculated and simulated metrics.
Cheers,
The Blockbax Team.