December 12, 2022 · 9 min read
Blockbax Platform highlights
We 💚 fast and frequent releases. New features are added on a daily basis, and this blog series will showcase our favorite new features. This blog’s highlights:
Subject composition improvements
More and more users are using our subject composition functionality to add extra context to their subjects (any asset or device you have connected). With subject composition, you can define parents for subjects, and take advantage of this composition within the Blockbax platform. You can combine subjects that ingest data, alongside subjects that add composition to your project. For example, when you want to create a composition to monitor rooms in a smart building you would need a hierarchy to correctly describe that building.
Below you will see an example of how you can combine a data collecting subject type, with composition based subject types:
Building
] --> B[Floor
Parent type: Building] --> D[Room
Parent type: Floor] --> F[CO2 Sensor
Parent type: Room]Subject overview
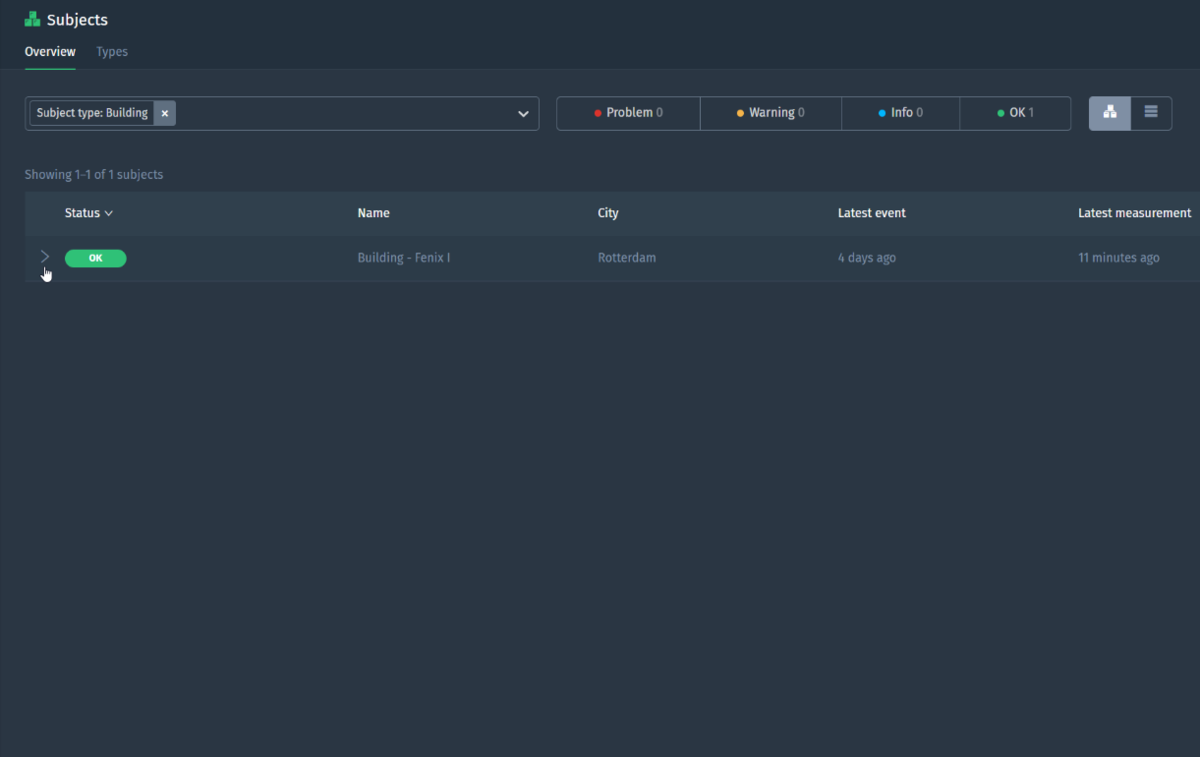
We have revisited our subject overview page in order to ensure an effective overview page for all of your subjects, including any subject composition. Firstly, when navigating to the subject overview page you will enter into a tree view which allows you to expand and collapse subjects that have any children defined on the basis of subject composition. Below you see an overview based on a similar subject composition as defined above. A CO2 sensor is placed in the Parking lot, located in the basement floor of the building. When you drill down the tree view, you can also easily identify the various subject statuses of it’s children since a parent will receive the highest status of it’s children.
Have a look as a Blockbaxer navigates the subject composition on the three view!
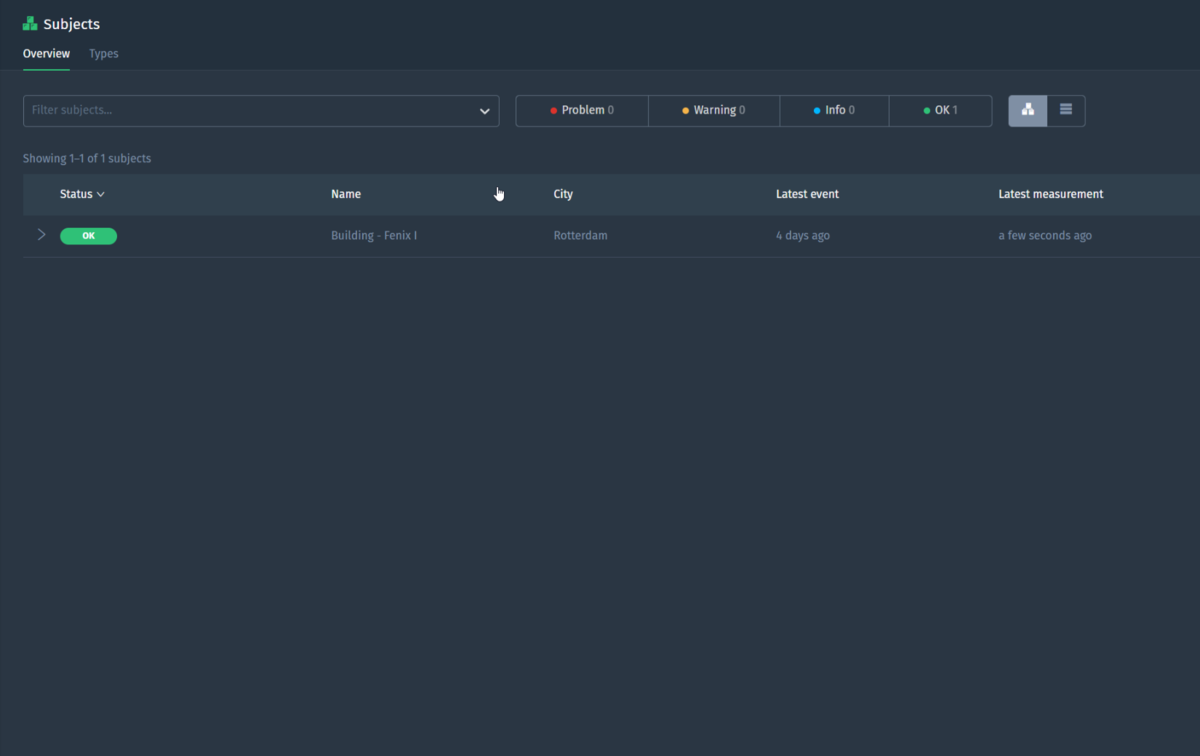
Alongside the tree view, we also made some adjustments to the list view. At the top right of the subject overview page you can change between tree view and list view. When using the list view you will now see additional information with regard to the defined subject composition. This view makes it extremely easy to search for a subject, as well as being able to see any details with regard to the composition when looking at the Name column. In the example, we can search for a CO2 Sensor and we see exactly what room, floor, and building it is linked to.
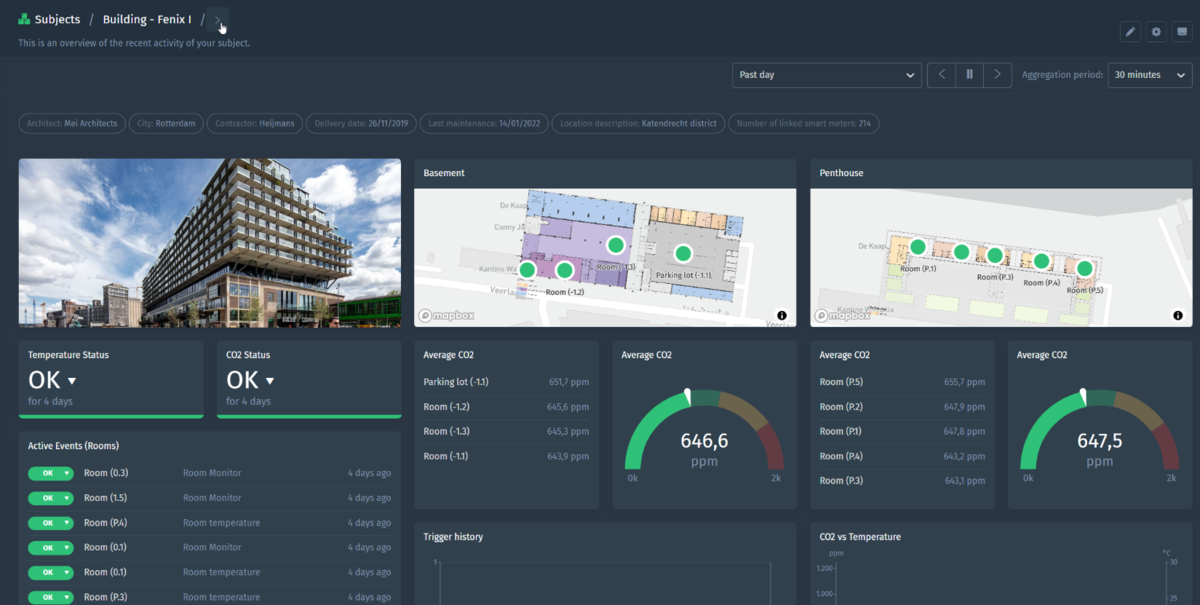
Breadcrumb
Being able to define parent types and define subject composition also requires easy navigation from a parent to its children, and vice versa. When you are viewing a subject dashboard of a subject that has a parent or children defined, you will now see a breadcrumb appear at the top. This allows you to easily navigate up to the parent, as well as any of its children. Have a look at the breadcrumb below:
Event detail page
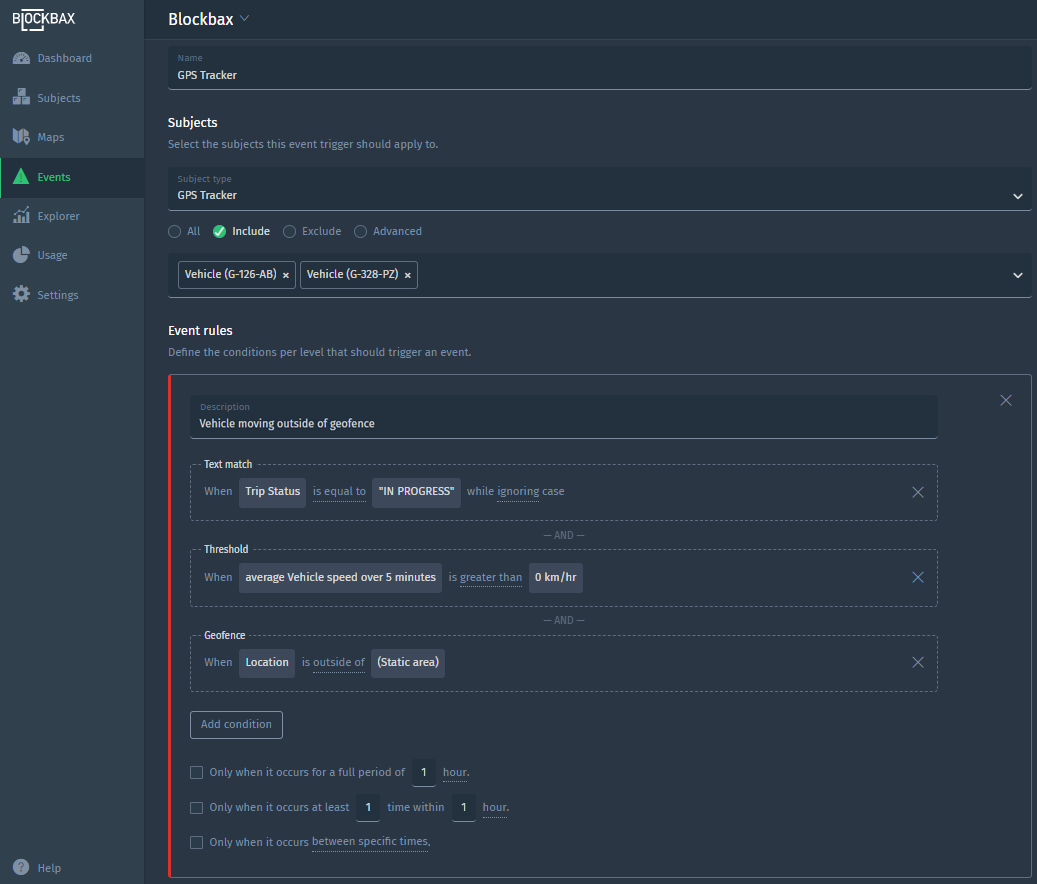
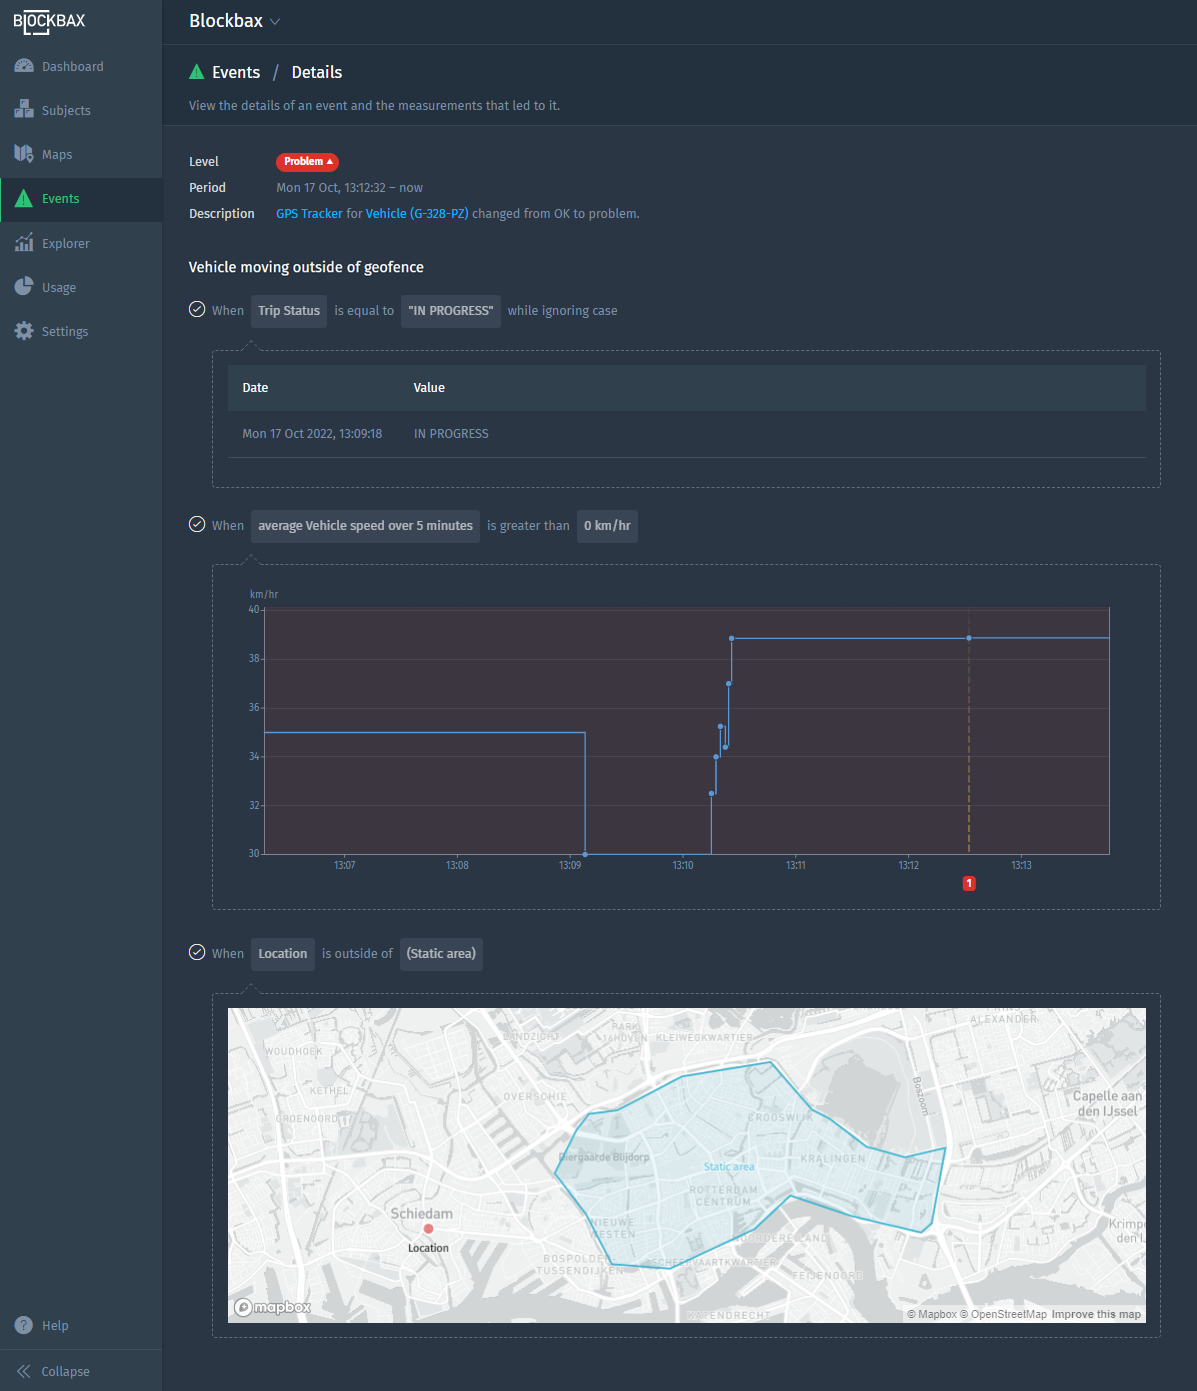
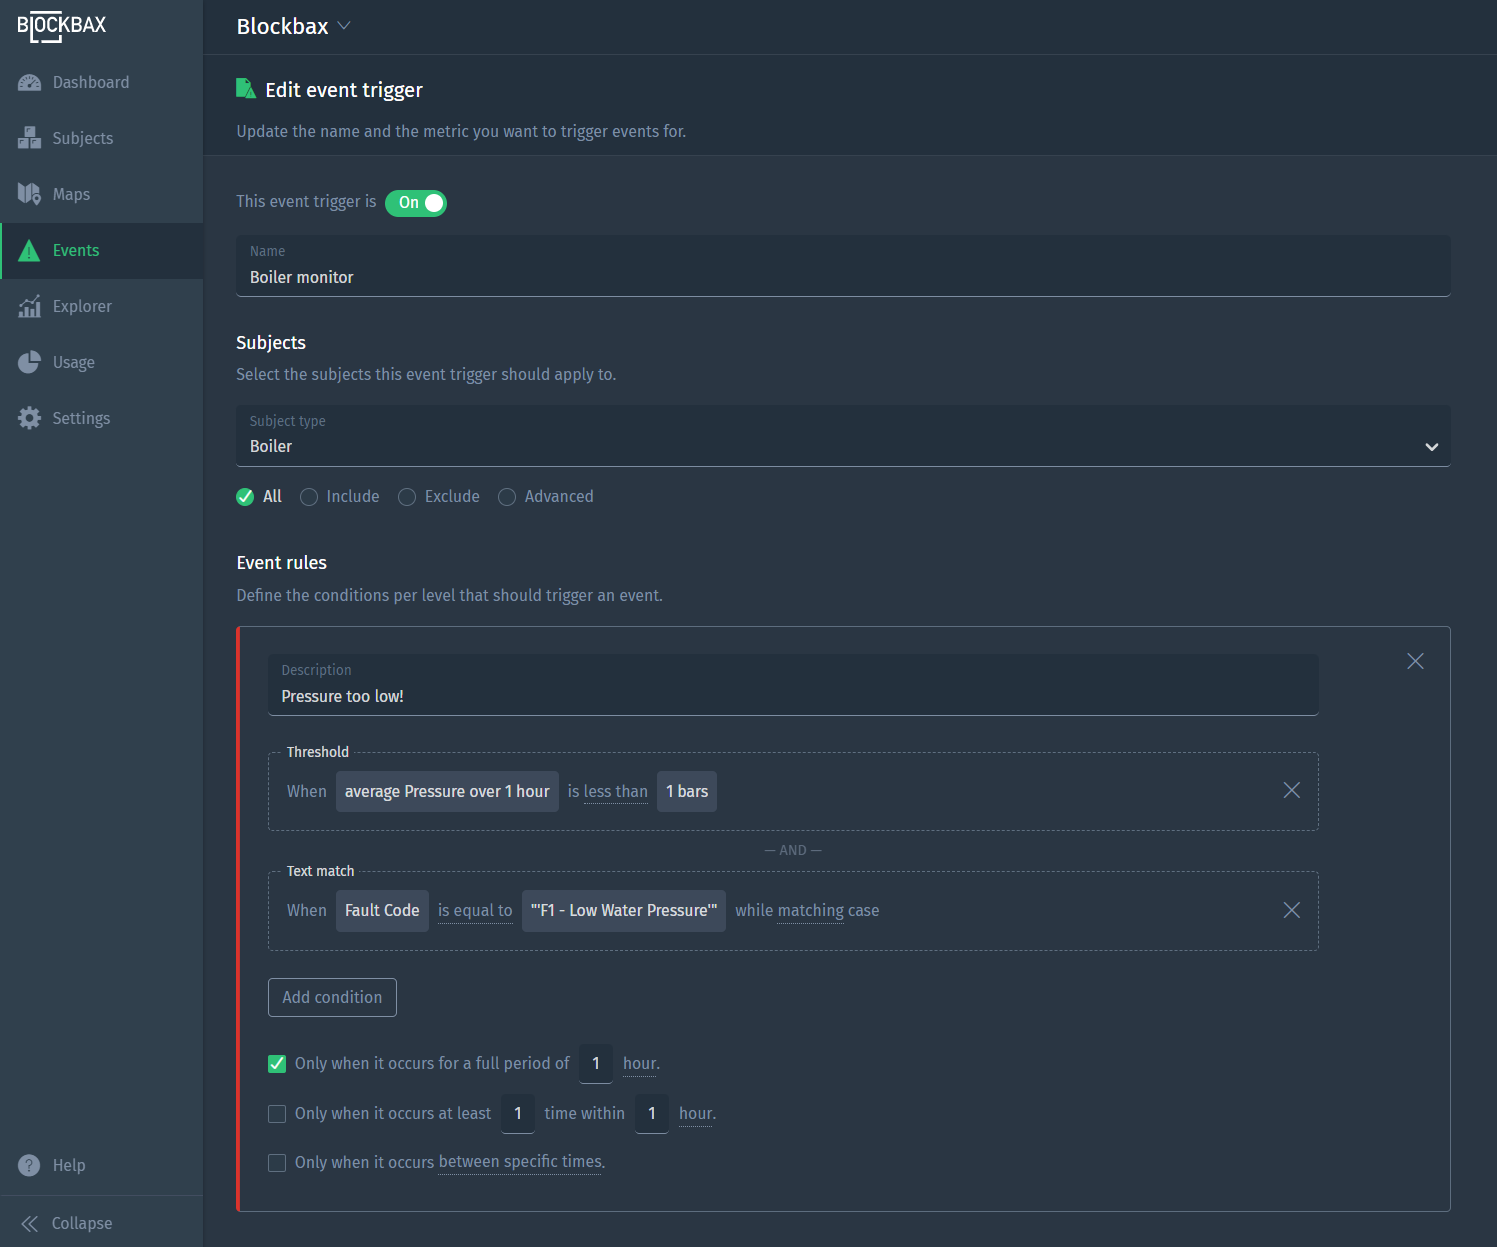
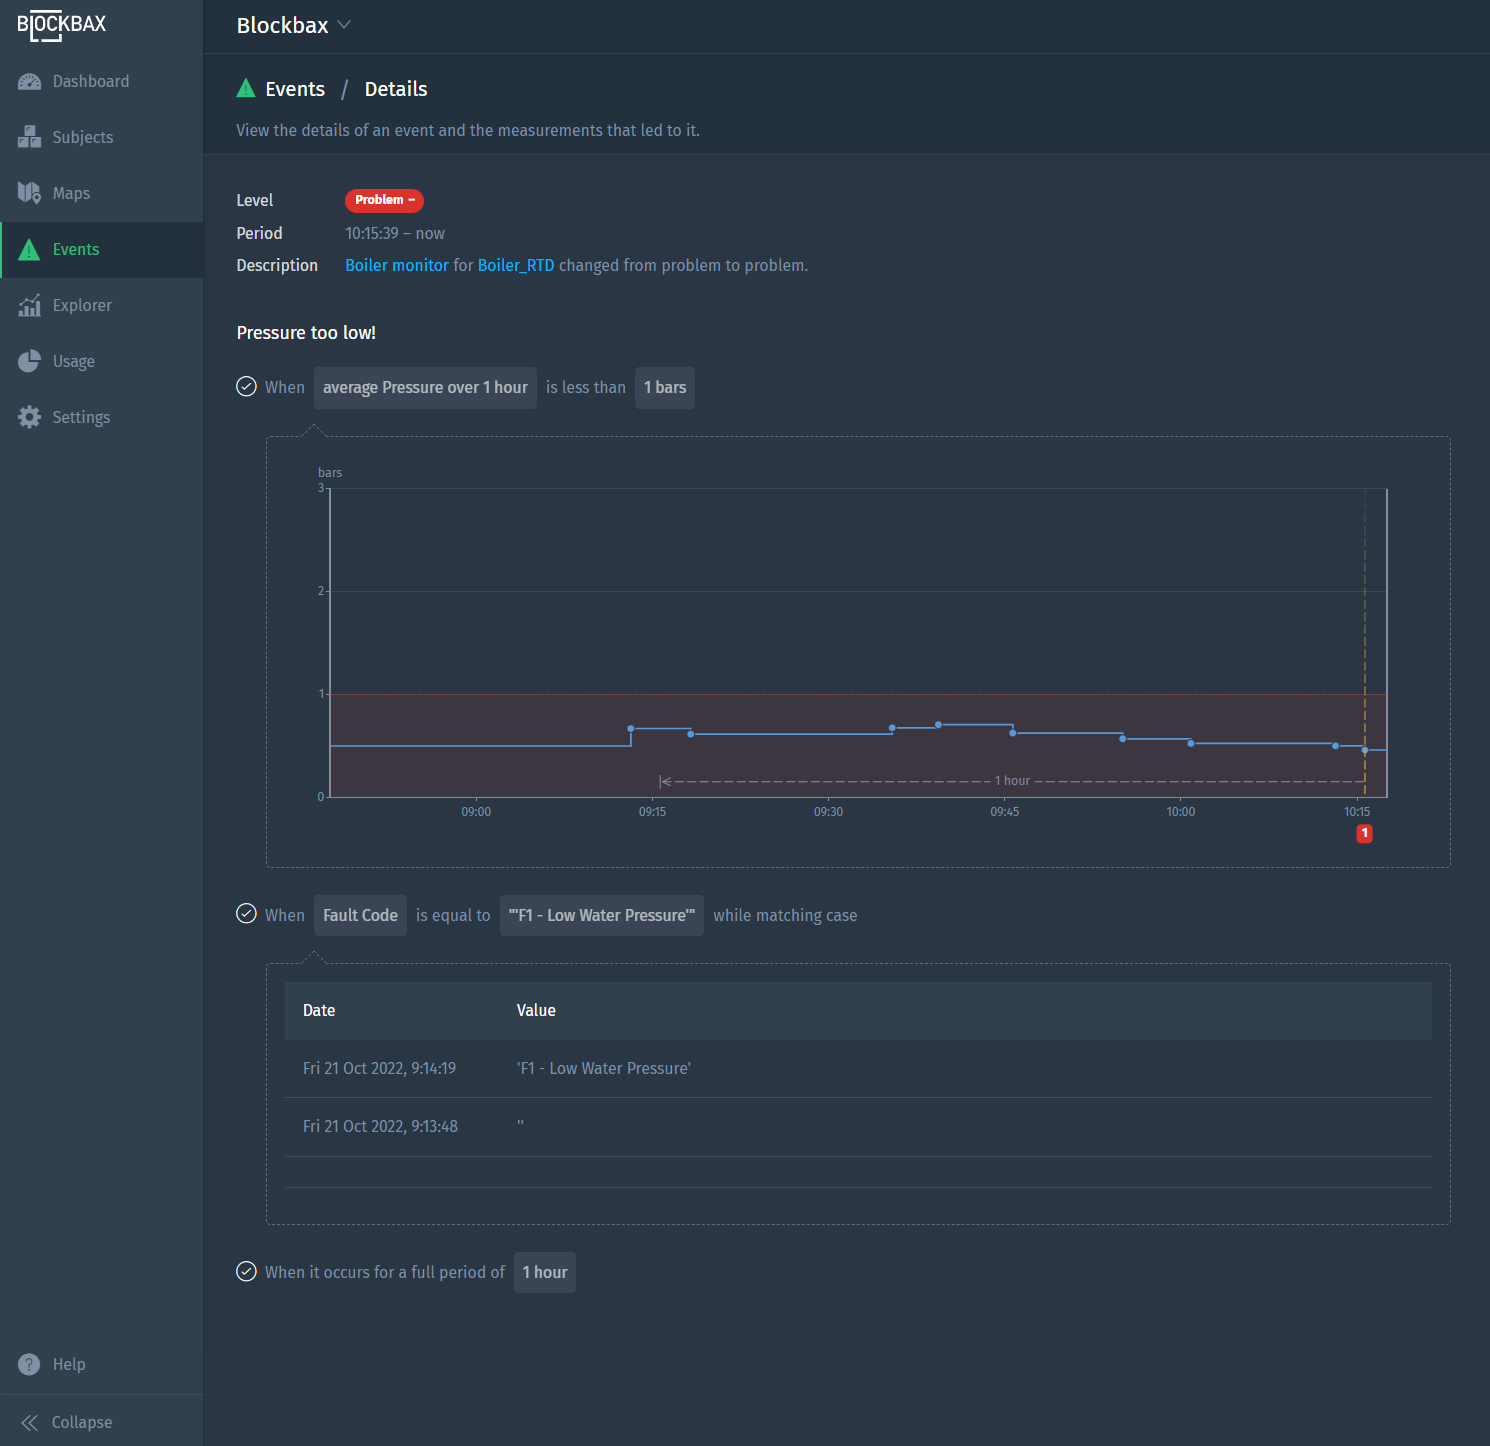
The event detail page is a crucial feature to ensure users are able to clearly understand the reason behind an event being triggered. Previously, when an event was triggered you were able to see the most recent graphs for numeric metrics. However, with the rapid expansion of our platform we also needed to ensure a correct display of relevant information for text metrics, newly added conditions such as geofencing, advanced change conditions and much more!
With the new visualizations, the event detail page shows you much more than before. For example, you can now also see the defined timeframes, aggregations such as averages and any defined thresholds for numeric values. For location values you are able to see the location, as well as any defined geofences on a map. Lastly, for text values you receive an overview of the most recent, as well as a number of previous metric values. This should give you a much more detailed view of the conditions that caused the event to trigger.
To show just a few examples, scroll through the gallery to look at some triggers as well as their event detail pages.
Heat map improvements
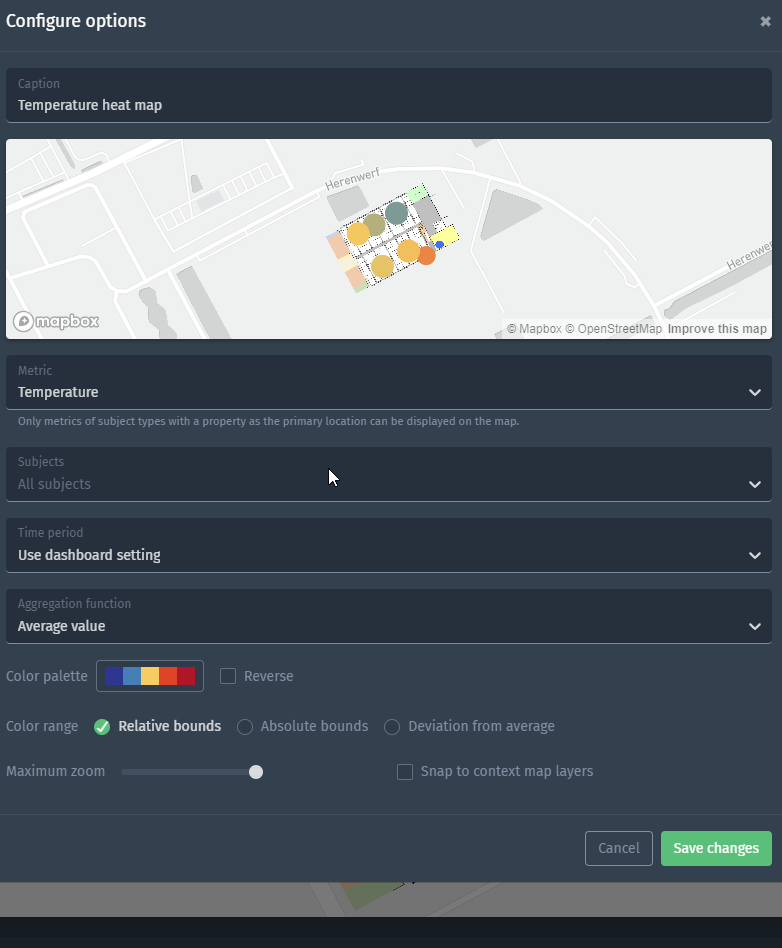
We love hearing your feedback! Based on the feedback from our customers who are actively using our heat map functionality we have added some additional settings to allow more flexibility when configuring your widget.
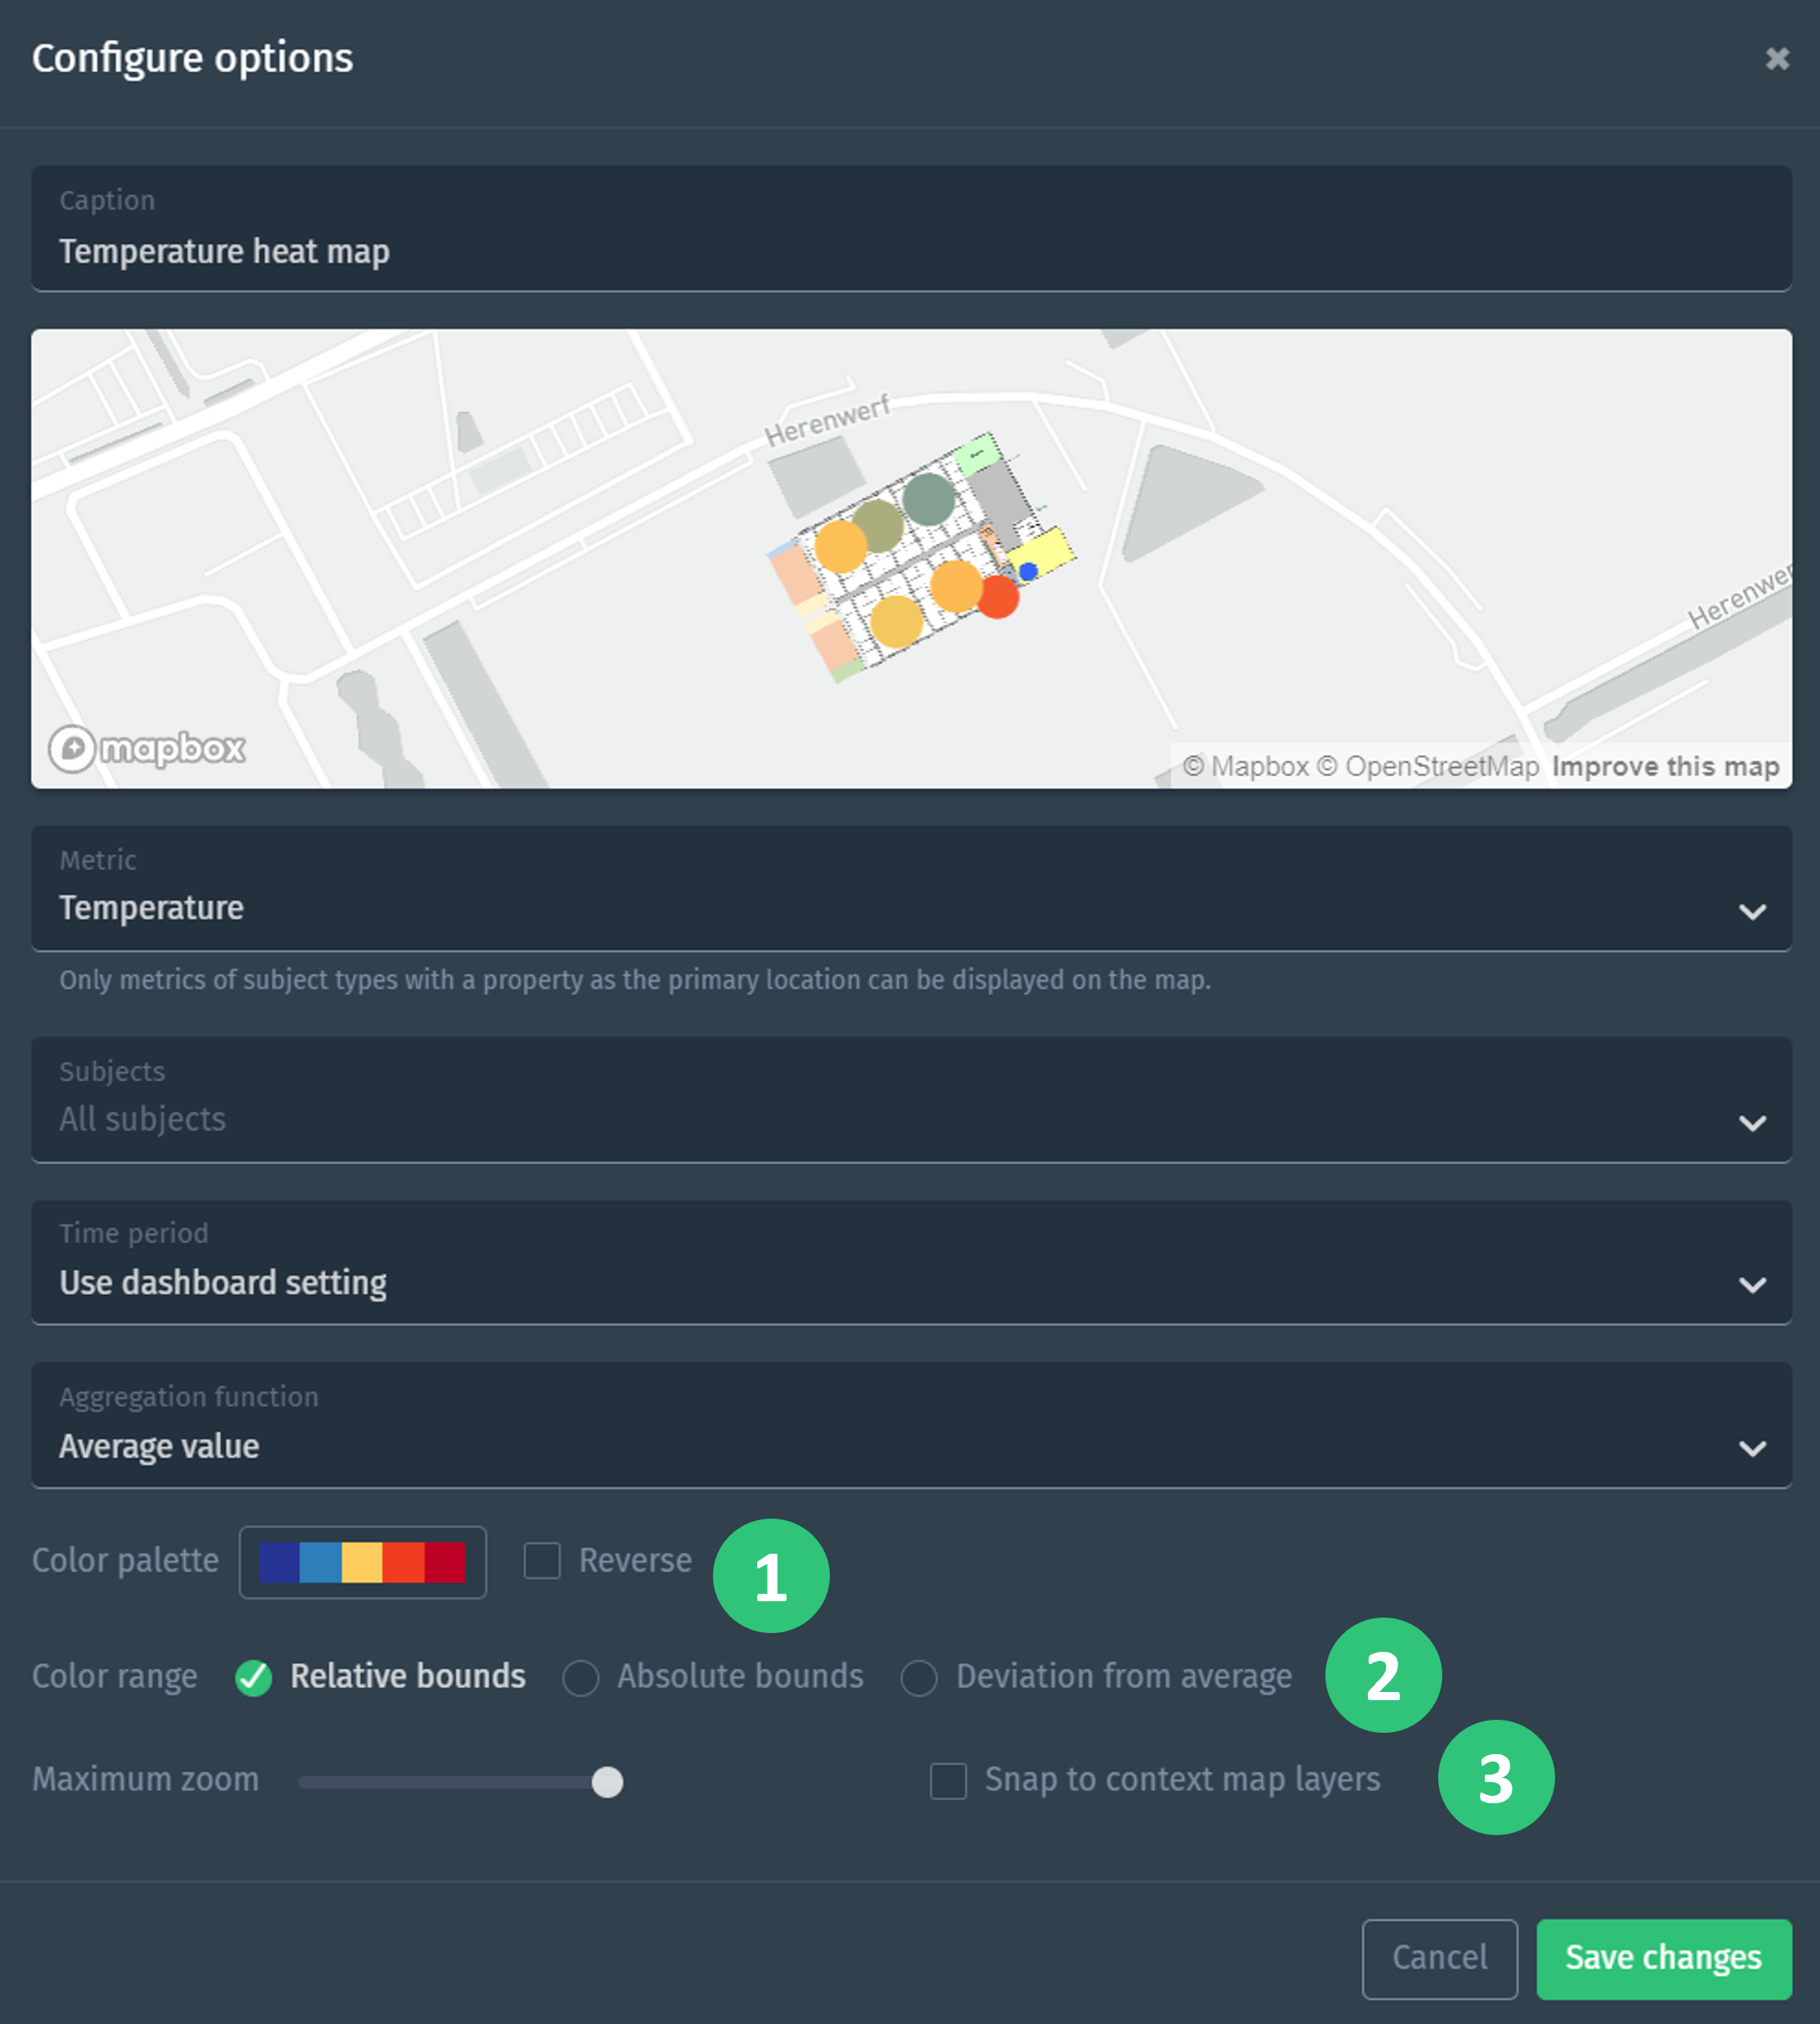
Among the changes we’ve added the ability to reverse (1) the defined color palette of the heat map. Secondly, you can now configure the color range (2) to be
- Relative bounds
- No additional configuration is needed, the heat map will look at the maximum and minimum to assign a color from the palette to each individual subject on the map.
- Absolute bounds
- Configure a start scale value, as well as an end scale value in case you need more control over the color of each individual subject.
- Deviation from average
- When selected, you can define a value deviation. This entails that the value deviation will be added to determine the maximum bounds, and subtracted to determine your minimum bounds based on the average of the displayed subjects. For example, if the average of your displayed subjects is 28, with a value deviation of 2 you will have a minimum bound of 26 and a maximum bound of 28 for display the various colors on a heatmap.
Lastly, we’ve added a setting to Snap to context map layers (3) which will ensure that the heatmap will base reorientate based on the map layers that are displayed. When unselected, the map will orient towards the north, whereas when the setting is selected the map will orient itself based on the orientation of the defined map layer.
See it in action!
Mobile updates
Of course we have not forgotten about our mobile app either! Recently we’ve made a few improvements to our mobile app:
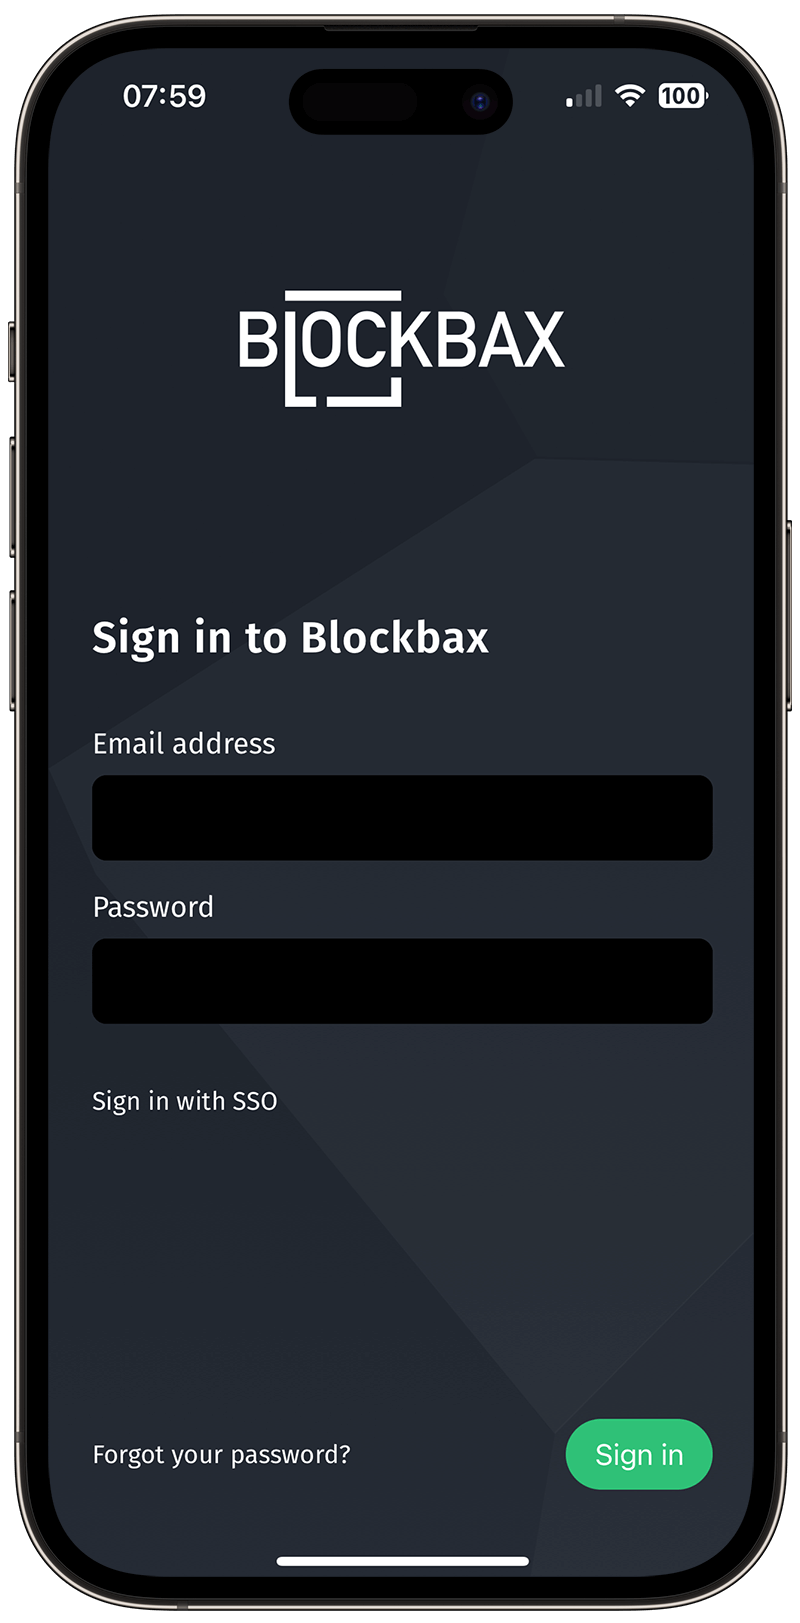
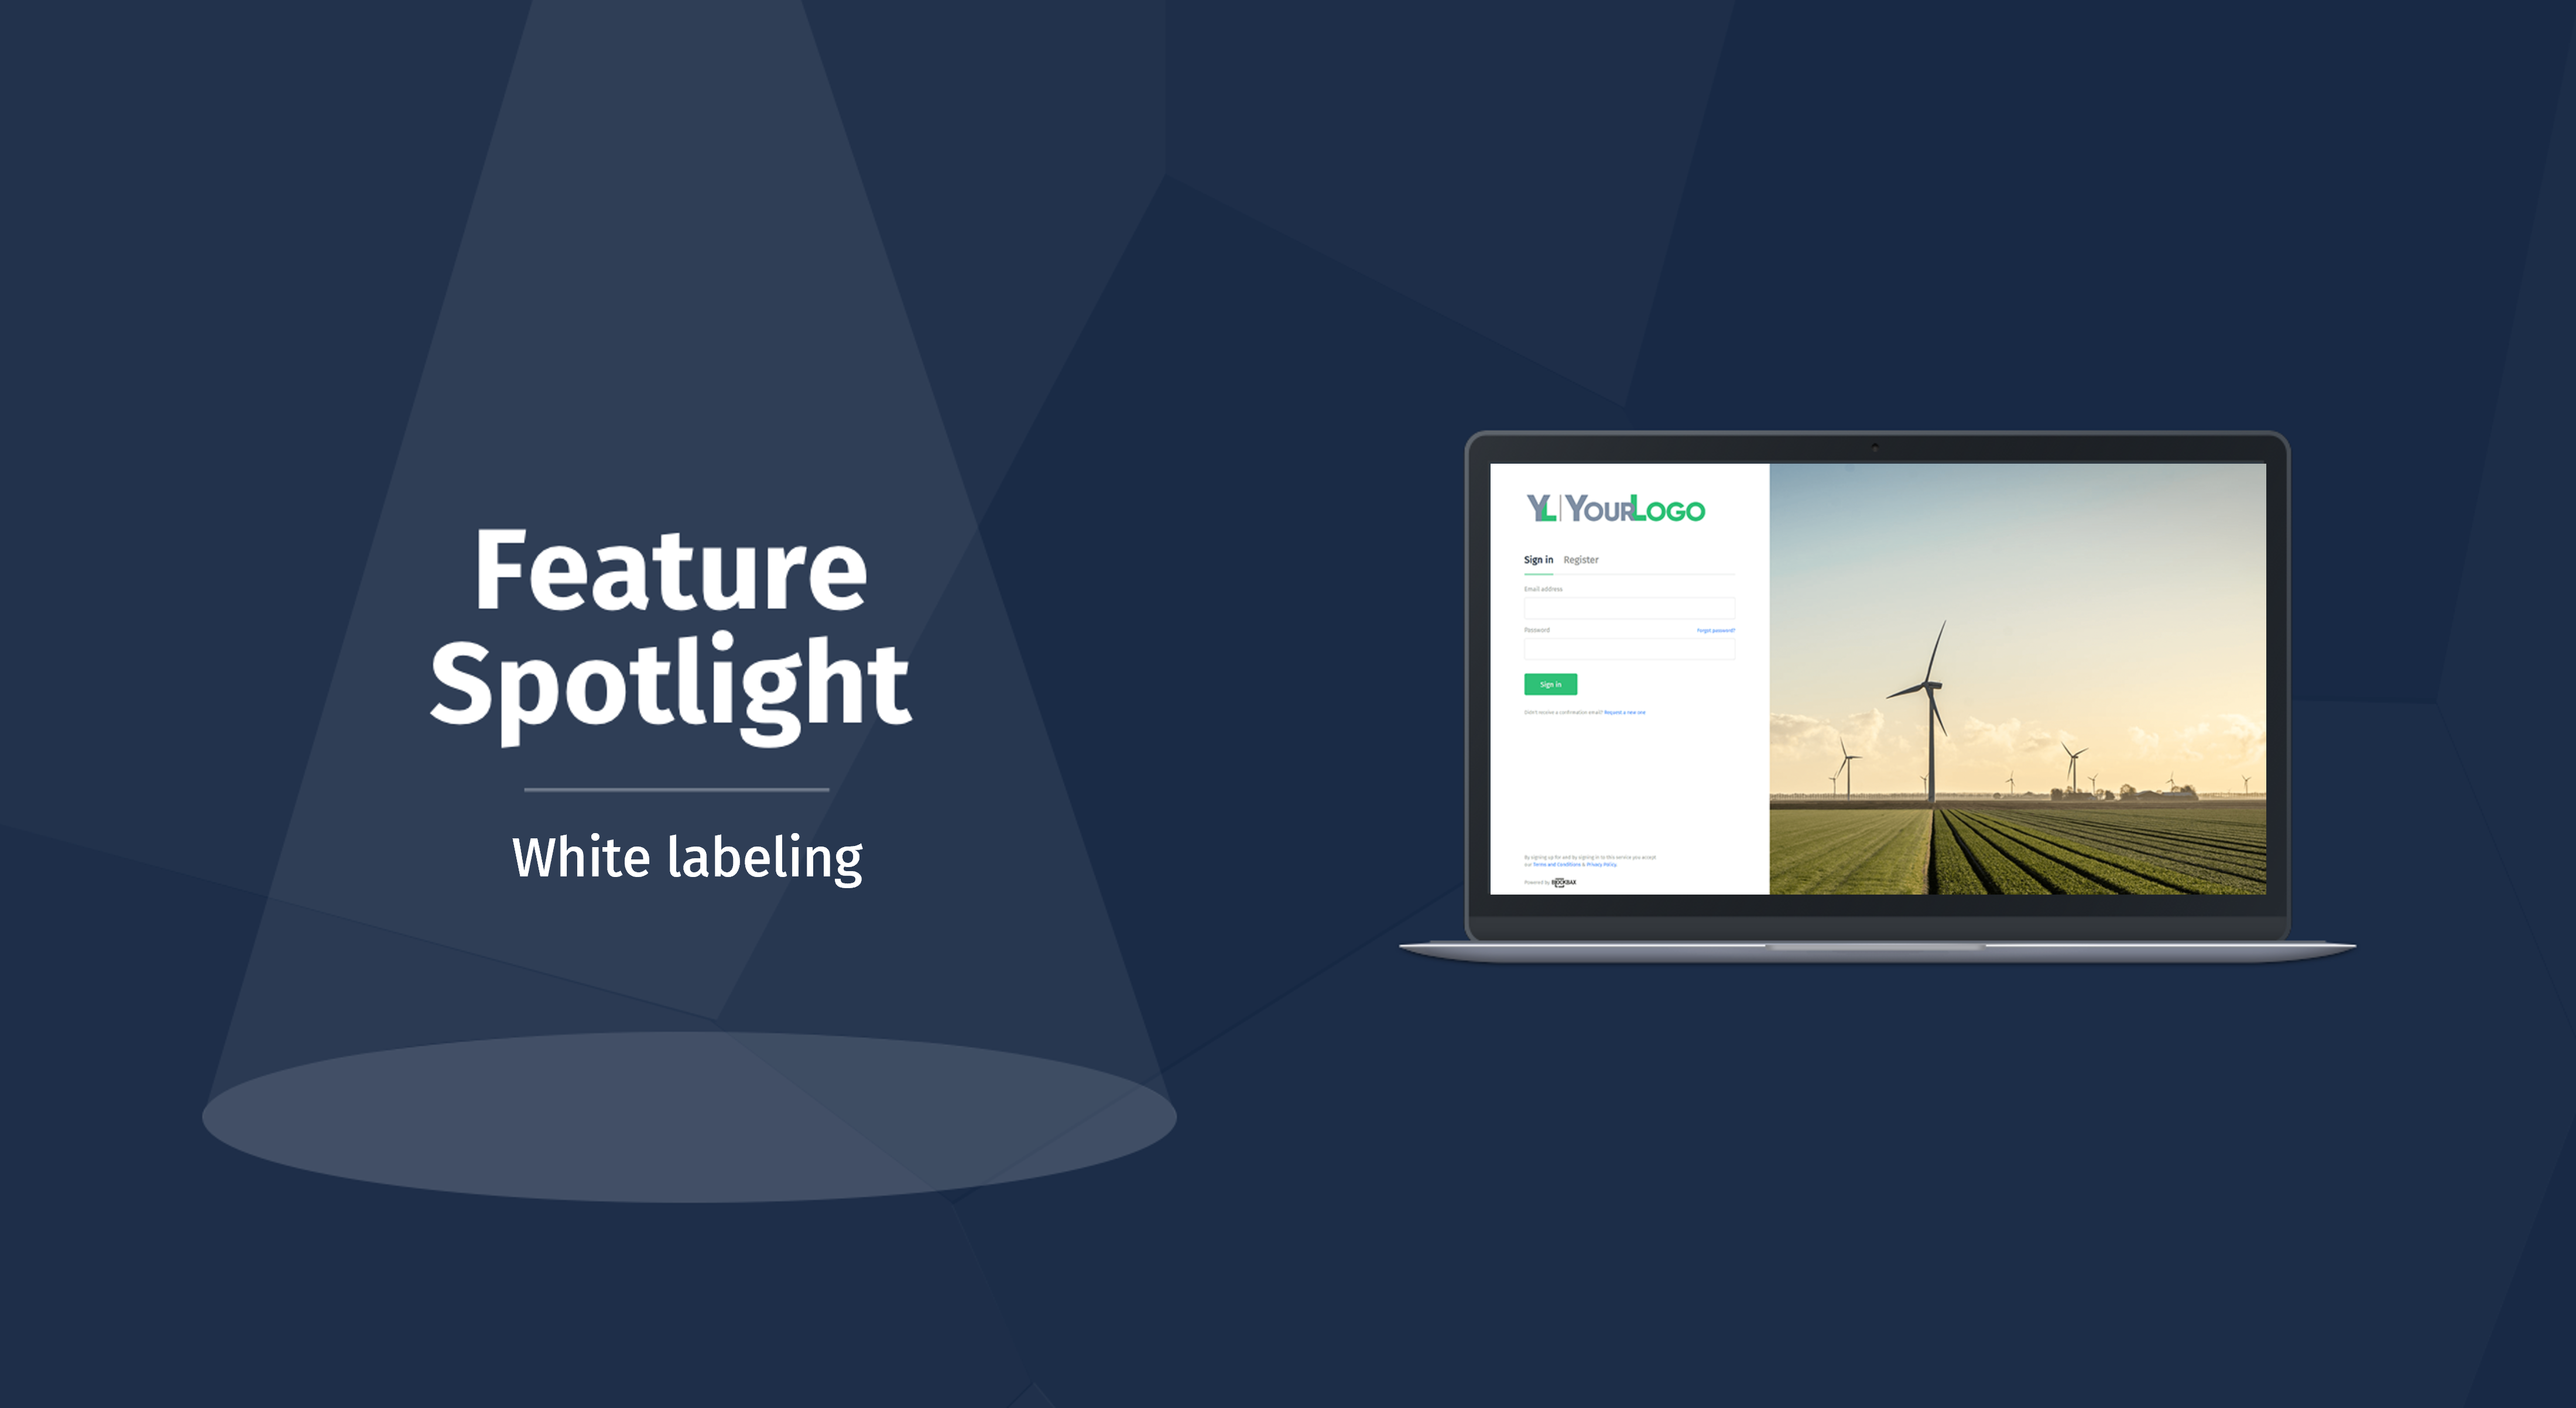
- SSO
- You can now use SSO in the browser but also in our mobile app, which was already possible in the web app.
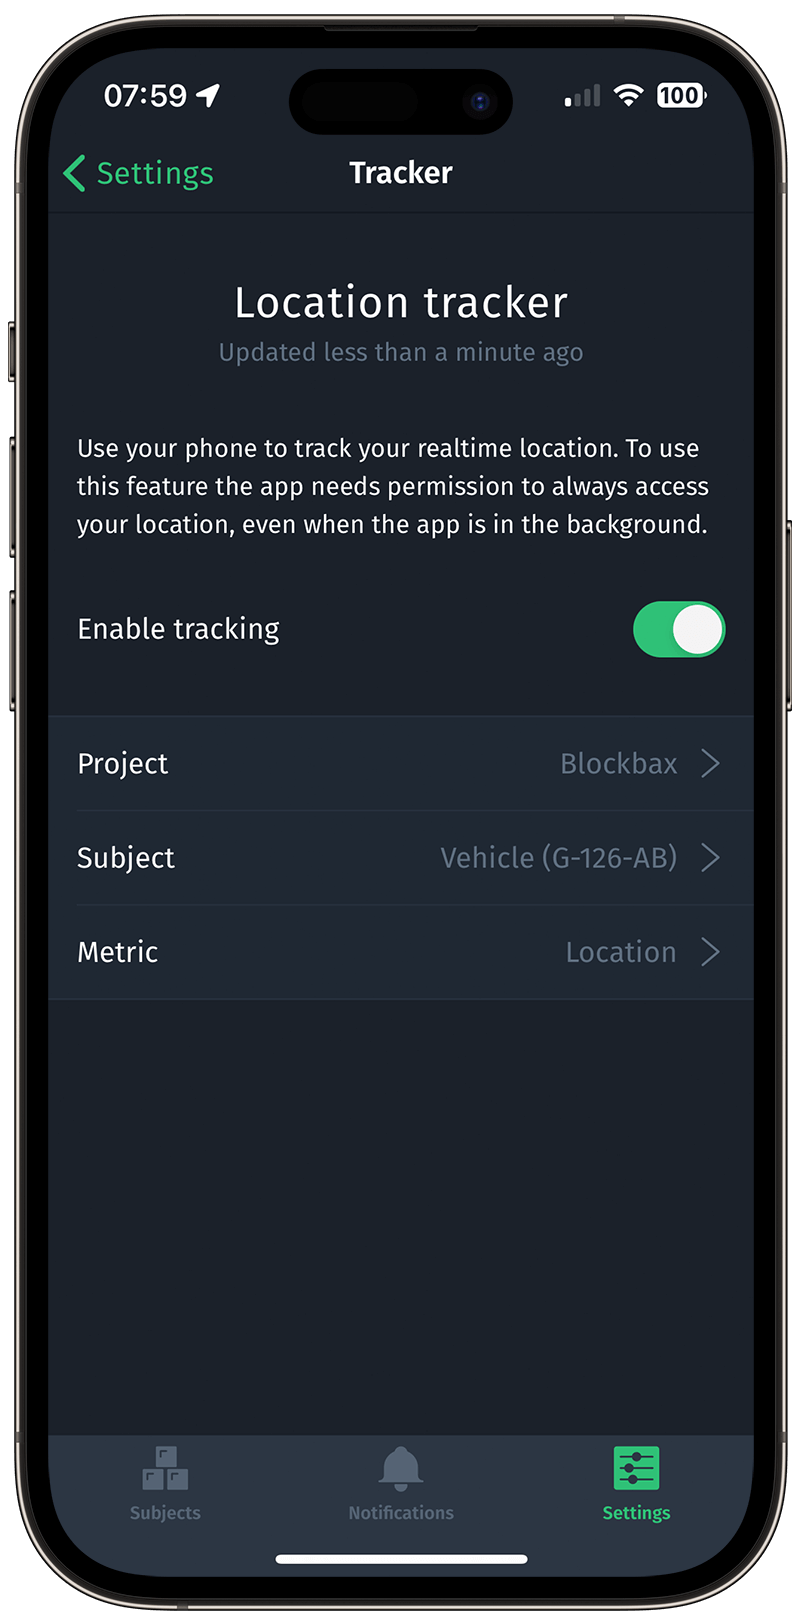
- Location tracker
- Our app now also doubles as a GPS tracker. After logging in, click the Settings button on the bottom right and you’ll see a new option Location tracker. When enabled, you can select a project, subject as well as a metric which you would like to collect data for based on your device’s location. No additional hardware needed, simply enable it when you would like to capture location data. We’ll revisit this topic and elaborate further in the near future!
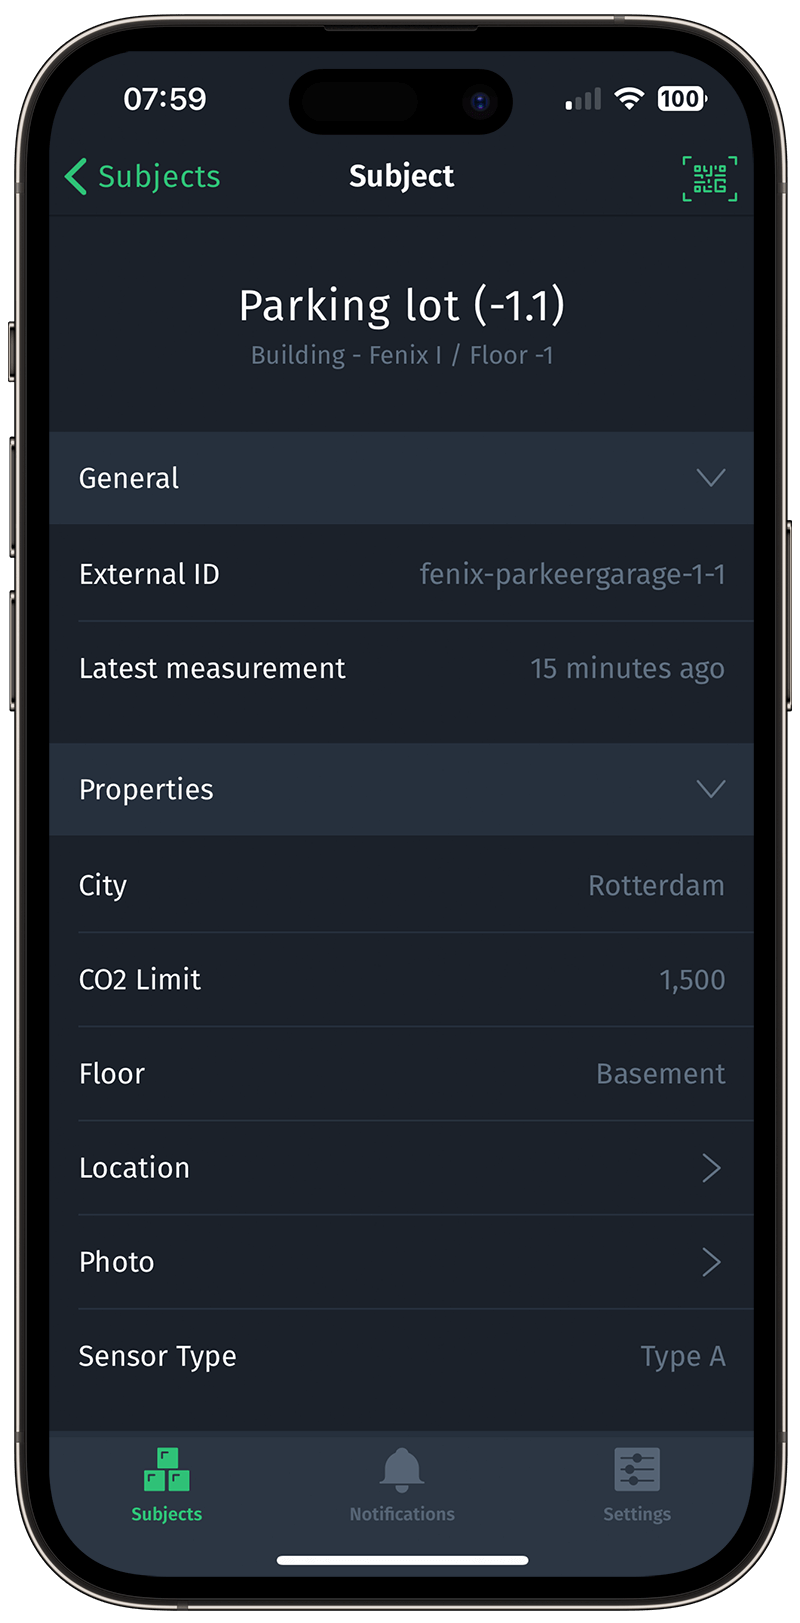
- Display subject path
- Going back to our subject composition improvements, we also made sure to adjust the subject detail page on our mobile app to show the subject path in the subtitle for the subject details screen, on the subject overview, as well as on the mobile event detail screen.
Try it out for yourselves!
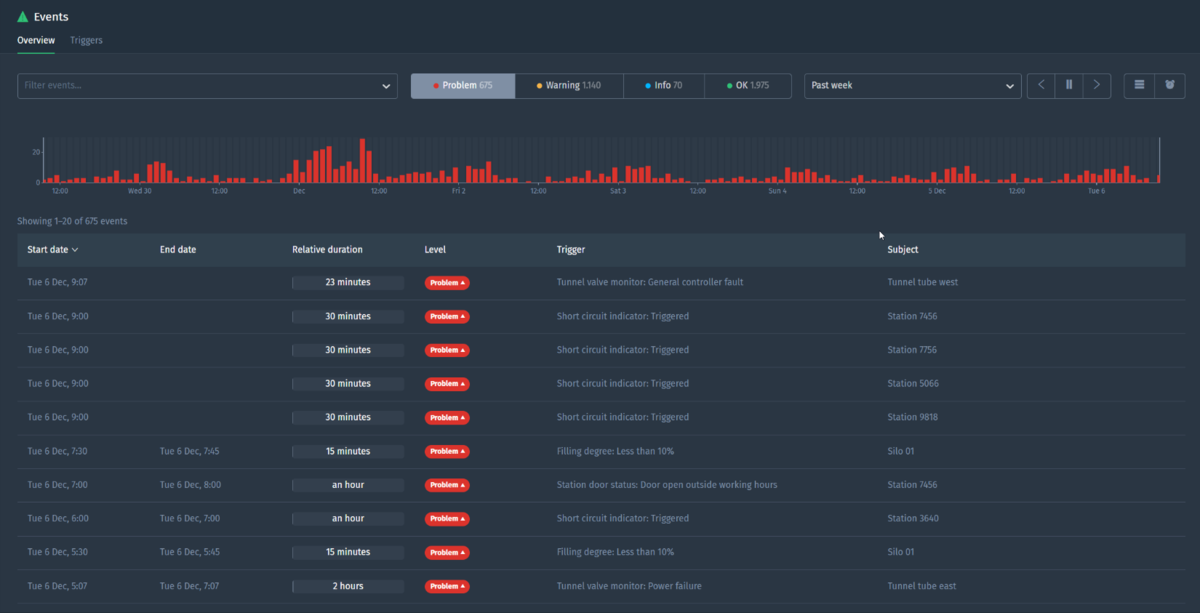
Pro-tip: Group similar events
Another pro tip comin’ at you! Ever find yourself wanting to understand your triggers even more, things such as frequency and duration? Head over to the Events overview page and click on the Group similar events button which will group events by subject, event trigger and level. You can then click on the headers to sort on your desired column for the insights you want! Check it out:
Ready to try it out?
All features and improvements mentioned in this blog are available to use right now! Are you new to Blockbax and do you want to see it in action? You can reach out to us and we will get back to you quickly.
Enjoy using all these cool new features and stay tuned for more editions of this blog series for more new features that we are currently building!
Cheers,
The Blockbax Team.

