June 11, 2021 · 5 min read
Blockbax Platform highlights

We 💚 fast and frequent releases. New features are added on a daily basis, and this blog series will showcase our favorite new features. This blog’s highlights:
- Subject composition
- Routes on the map
- Map layer and image properties
- Performance optimizations
- Pro-tip: Inspecting individual lines
- Sneak peak: Python SDK
Subject composition
In the real world assets, or other entities are often composed of one another. For example a building consists of floors, and floors have multiple rooms. Another example is a machine which is composed of several components. It is now possible to replicate these structures in your Blockbax project using subject composition. In the case of the building example the status of a building subject is determined by the combined status of its floors, and the floors of the status of its rooms. Moreover, properties that are configured at the building level can be inherited at the floor and room levels. For advanced users: subject composition can also be used in filters to select descendants, and to show descendants on a subject dashboard page.
Any type of real world asset composition can be modeled using this feature. Check out the docs to get started!
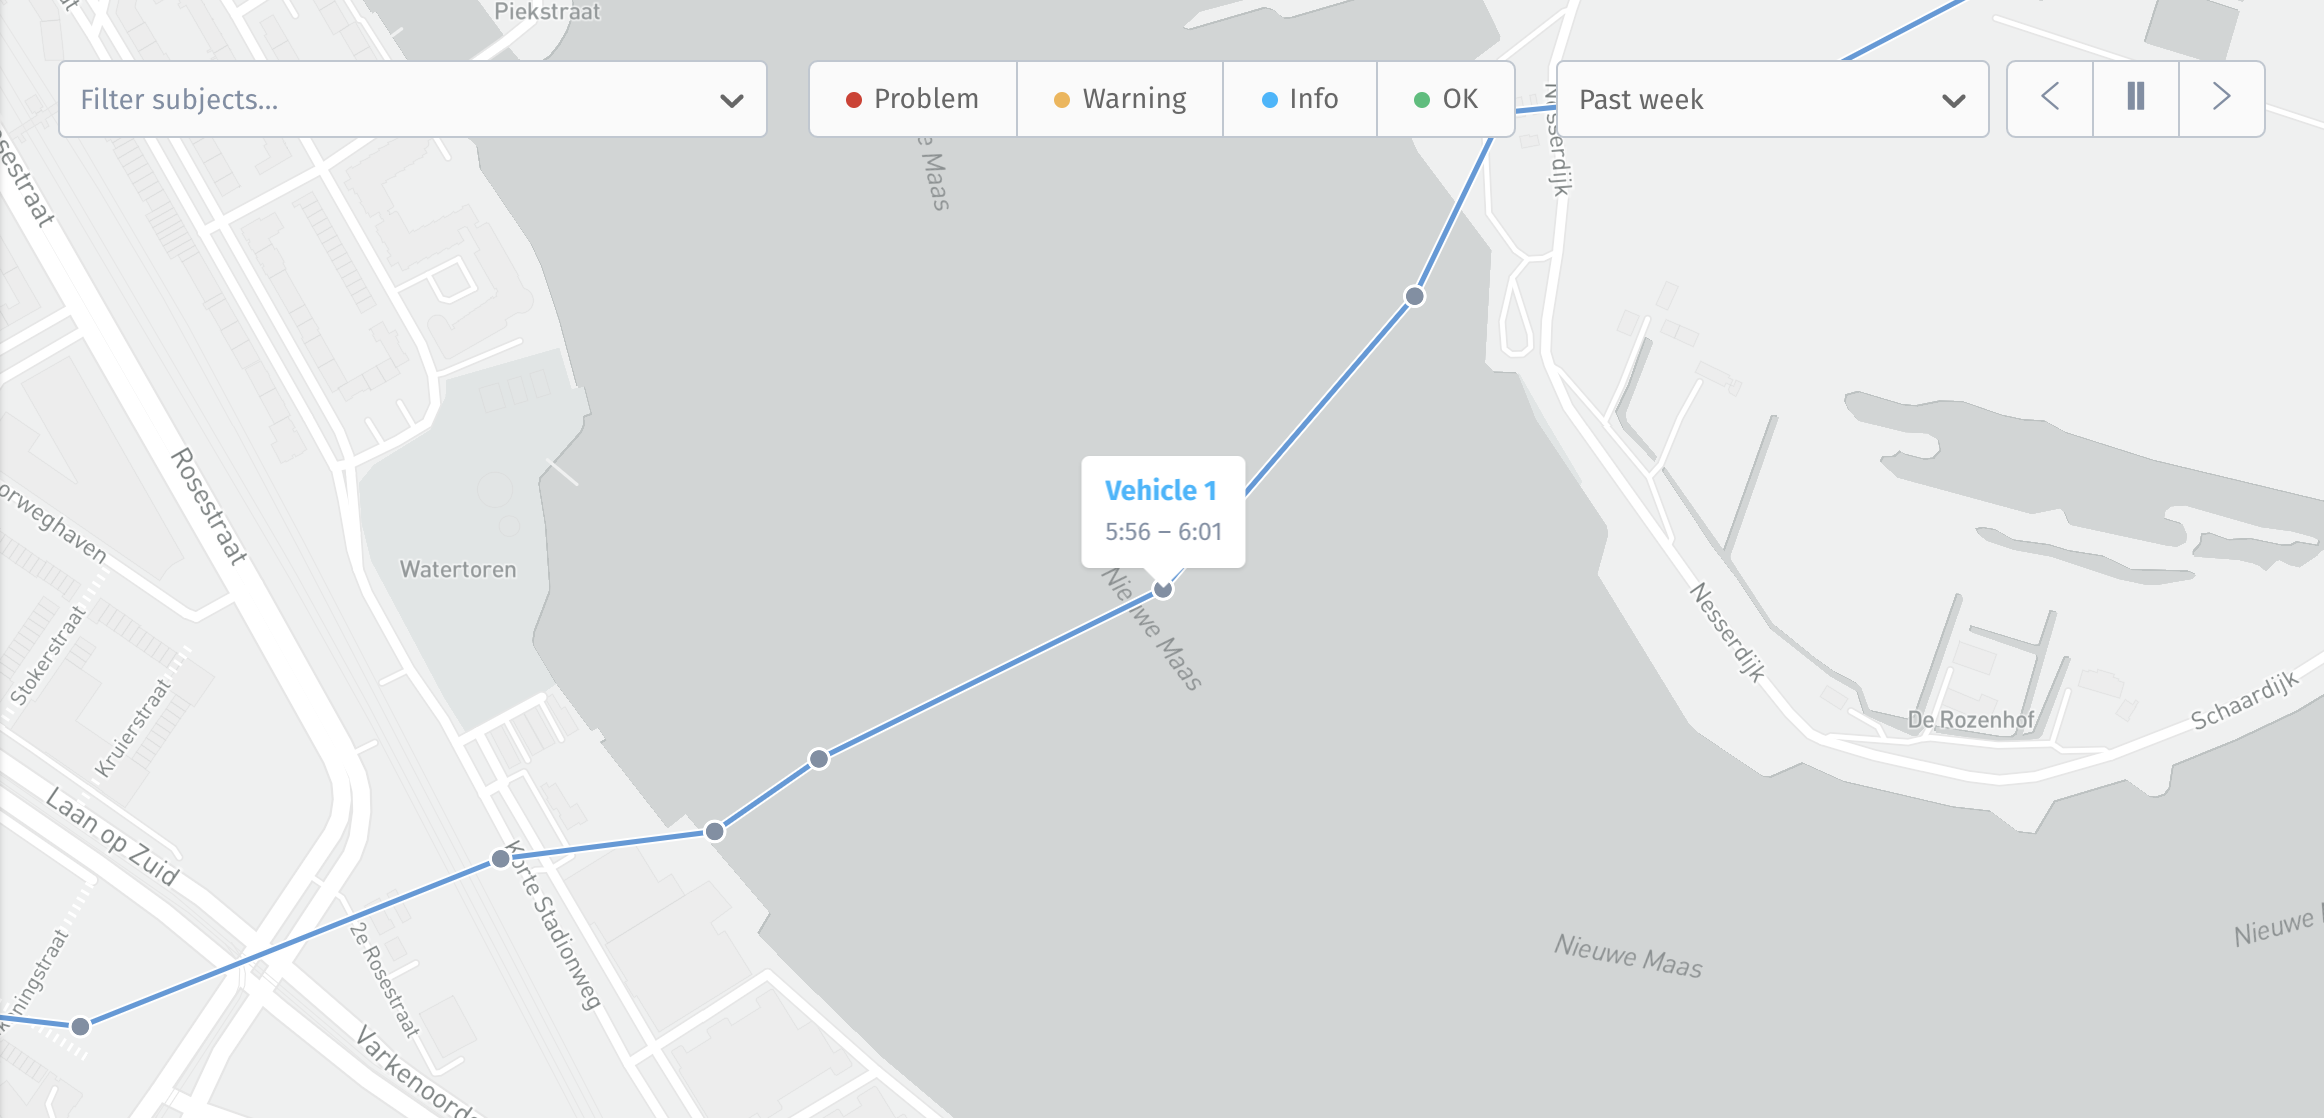
Routes on the map
Location measurements are a special kind of measurements: we visualize them on a map instead of in a graph. However, just like with numeric measurements, the current value doesn’t tell you the full story. We now allow you to select a time period to view historic values for location metrics as well.
But we didn’t stop there: we also show you the status of subjects while they were at a location. By default this status is determined by all event triggers that apply to a subject and its descendants. When selecting specific event triggers, the status will be based on just the selected event triggers.
Map layer and image properties
We introduced two new property types: map layers and images. These powerful additions allow you to add more context to your subjects and create even richer visualizations.
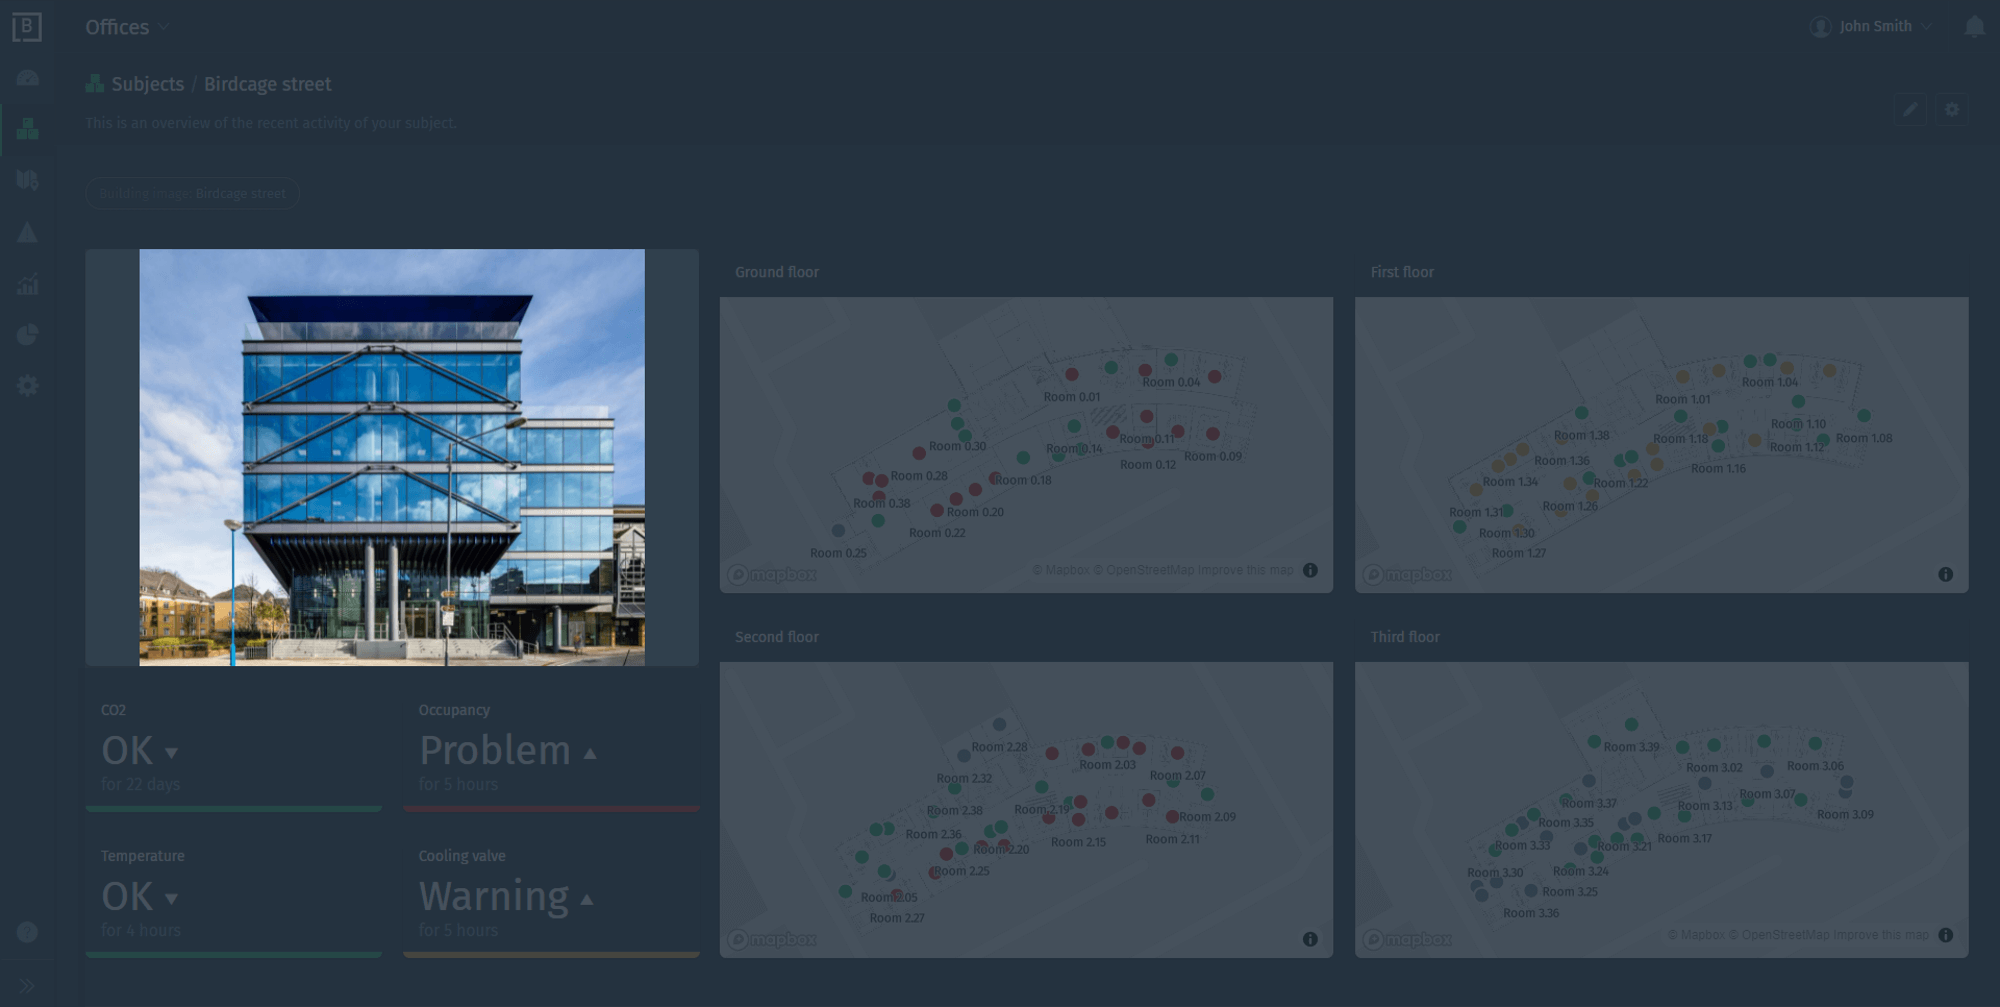
Map layers
Earlier we introduced map layers to add extra layers of information to the map. These global map layers are always visible, regardless of which subjects are displayed. We now introduce map layer properties that allow you to assign a map layer to a specific subject. The subject composition in your project is used to automatically show map layers depending on the context, by rendering each subject on the map layer of its parent. What does this mean in practice? This allows for various powerful use cases, for example you can show the rooms on the schematic representation of its floor.

Images
A picture is worth a thousand words: multiple users requested the ability to show a picture on their subject dashboard. A picture often helps to quickly identify a subject, or to provide some additional visual information. With the new image property you can now upload a picture for a subject. The new image widget can then be used to display this picture on your subject dashboard.
Performance optimizations
We have devoted EXTRA attention to improving the performance of our API services and web client. For large projects (with thousands of subjects and billions of monthly measurements) API requests and client page loads are up to 100 times faster. The effects of these improvements are noticeable all throughout the web client, but in particular when analyzing aggregated data over greater periods of time in the explorer or dashboard widgets.

Pro-tip: inspecting individual lines
When showing multiple subjects in the Explorer, it is often useful to quickly see how one subject compares to the others. We just made that a lot easier by highlighting individual subjects when you hover them in the sidebar. Similarly, when having multiple series, hovering a series panel will temporarily dim lines that belong to other series.
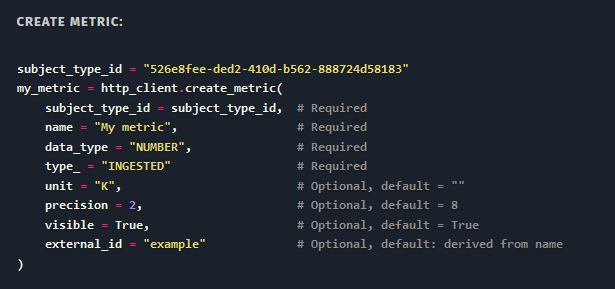
Sneak peek: Python SDK
This snake in the grass has been hiding, but certainly is not dangerous. By using the upcoming Python SDK developers no longer have to deal with the intricacies of HTTP requests and responses. This simplifies and speeds up development of data science and machine learning applications on top of your Blockbax projects. A first version of the API documentation has been published. If you are interested in trying the SDK please get in touch!
Ready to try it out?
All features and improvements mentioned in this blog are available to use right now! Are you new to Blockbax and do you want to see it in action? You can reach out to us and we will get back to you quickly.
Enjoy using all these cool new features and stay tuned for more editions of this blog series for more new features that we are currently building!
Cheers,
The Blockbax Team.