March 15, 2024 · 2 min read
Subject overview widget
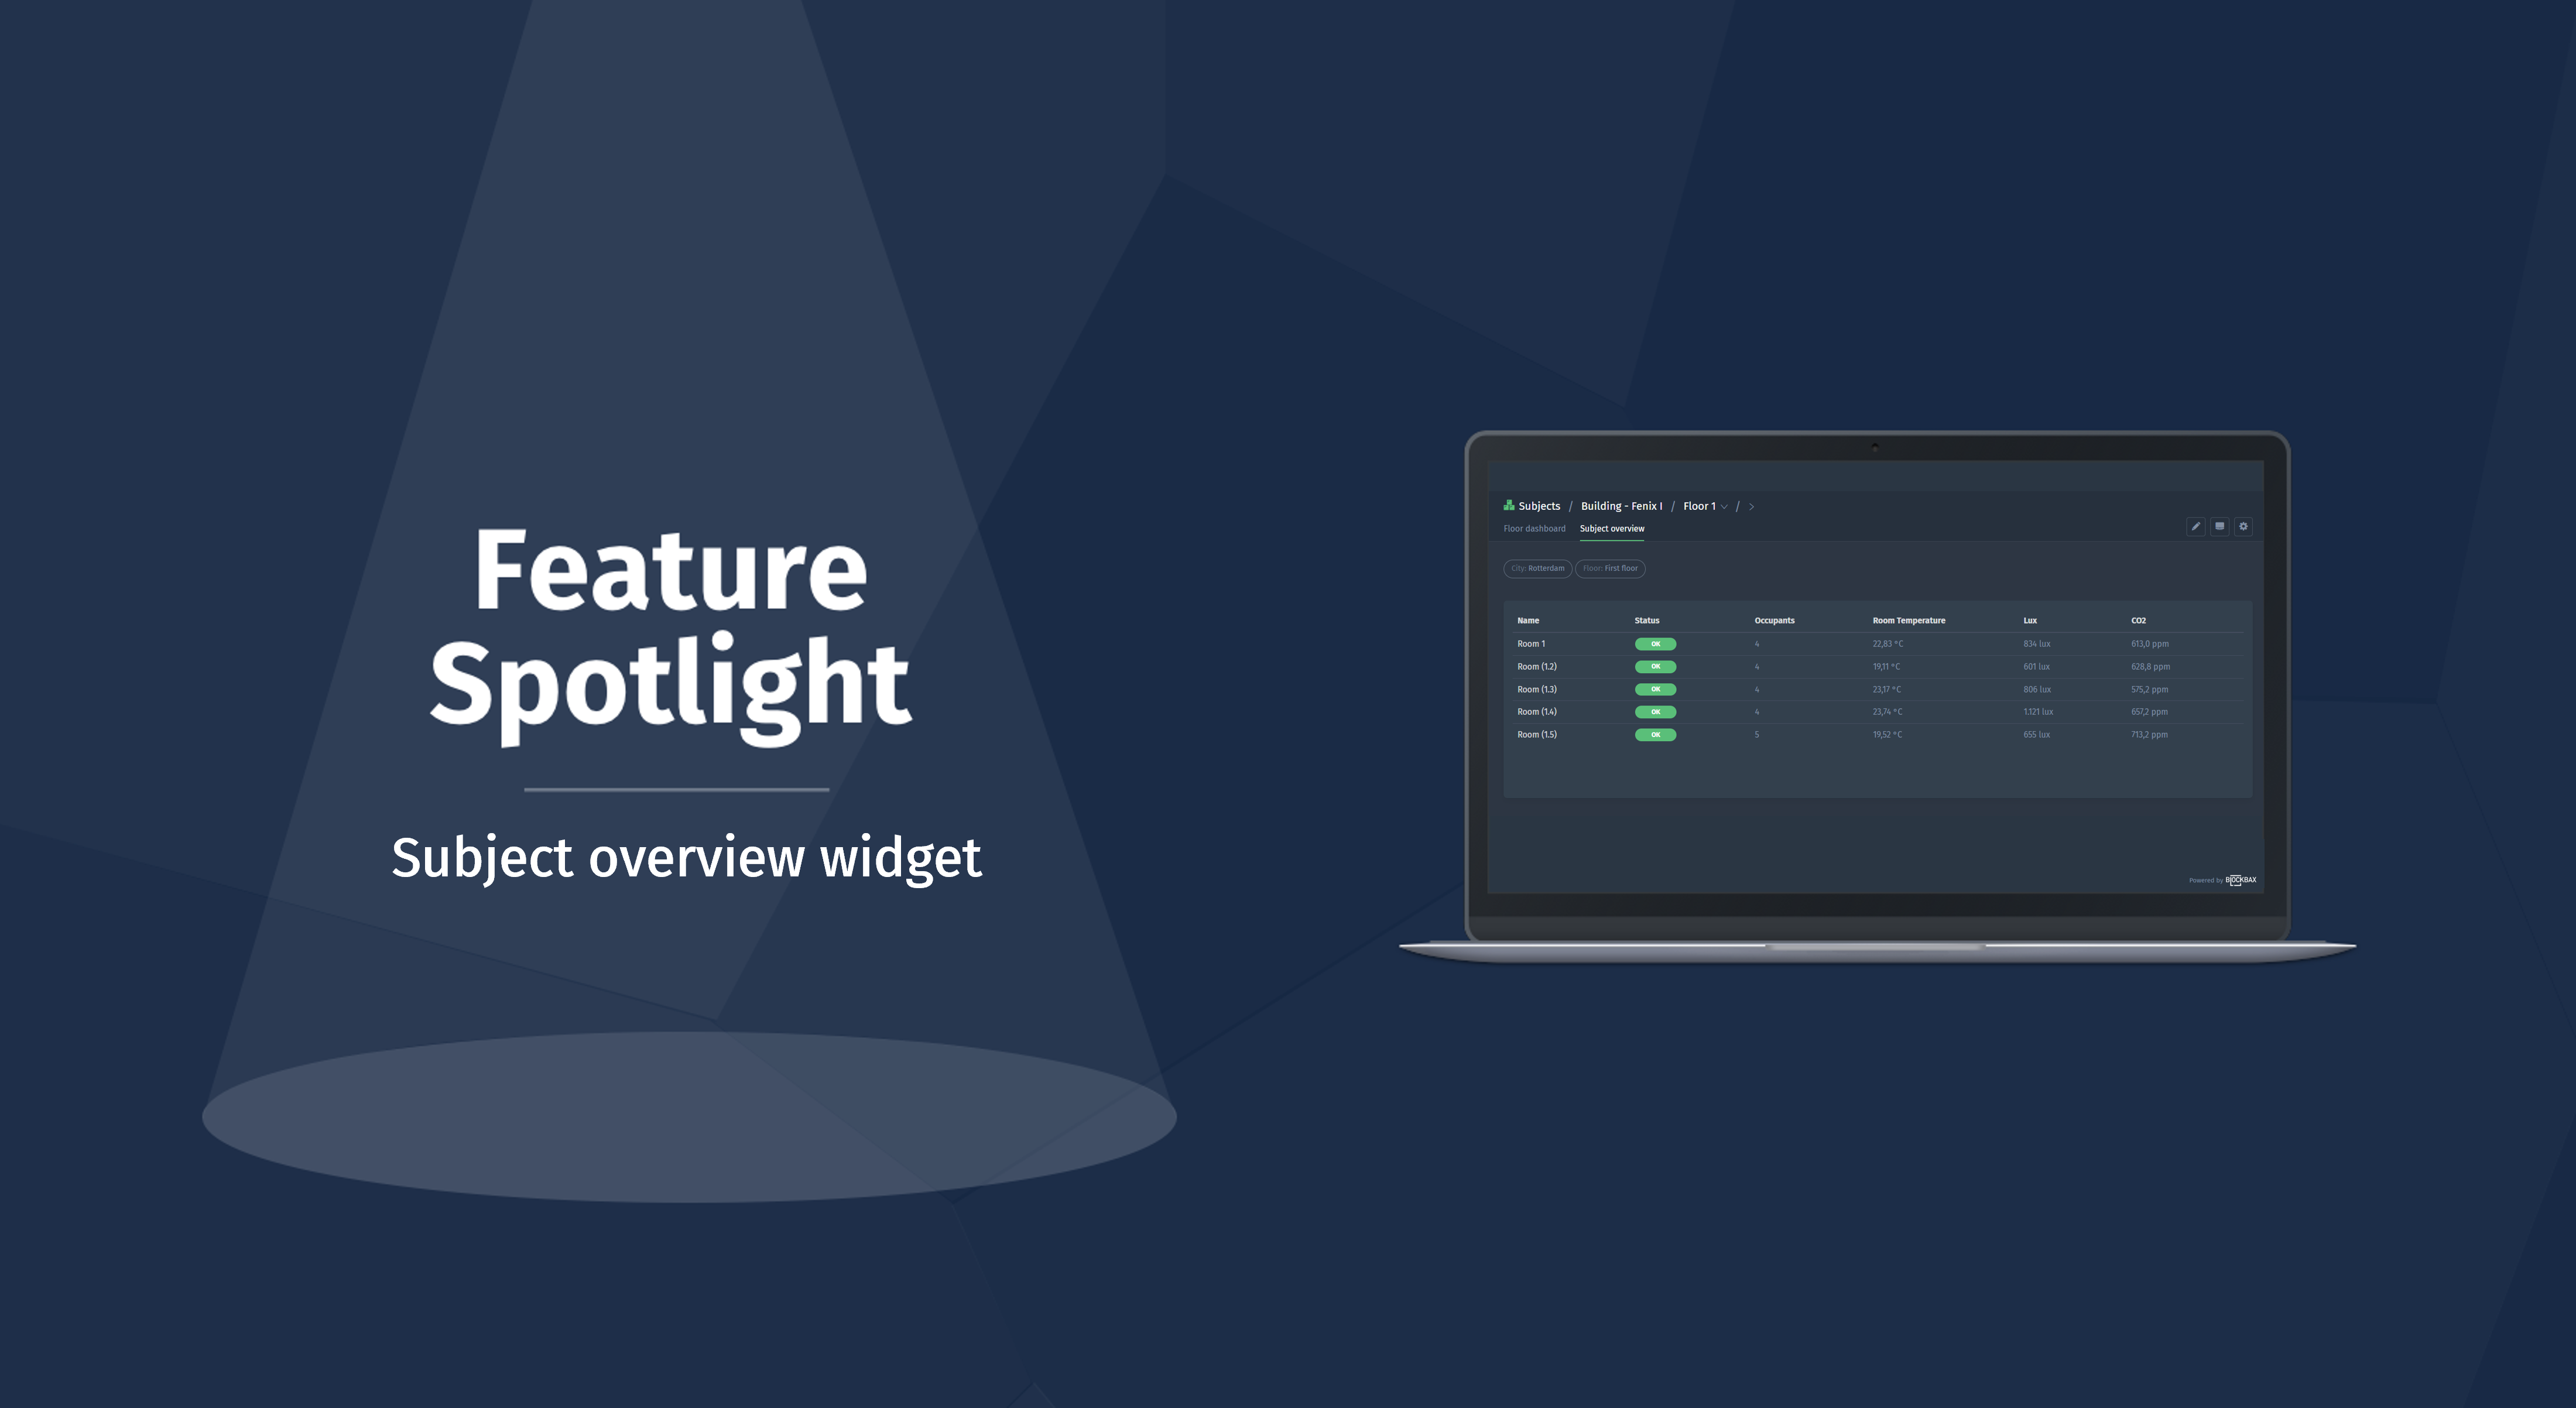
We’ve got some exciting news for you and we would like to share it with you through the release of today’s Feature Spotlight.
You may have used a Top list on your Blockbax dashboards previously, but with the release of a new visualization we have renamed the Top list to the Table widget. Why, you may ask? Well, next to the existing functionality of being able to create lists to show Active events, Events, Measurement statistics and Recent measurements in a simple list form, we are now very excited to share with you a new way to display your data, namely through the newly released Subject overview.
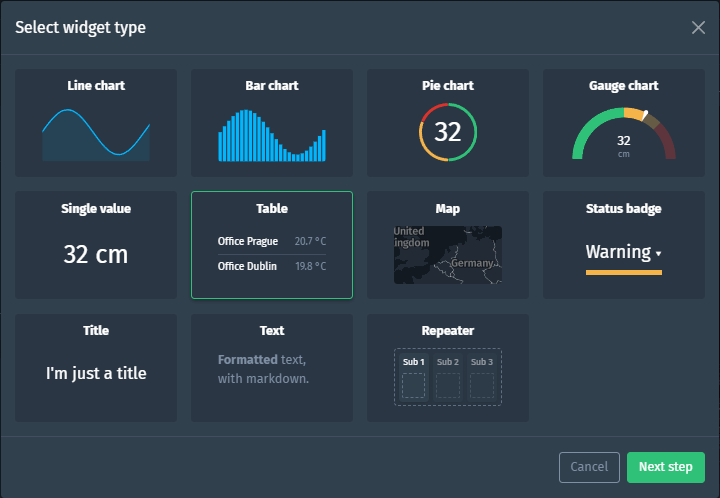
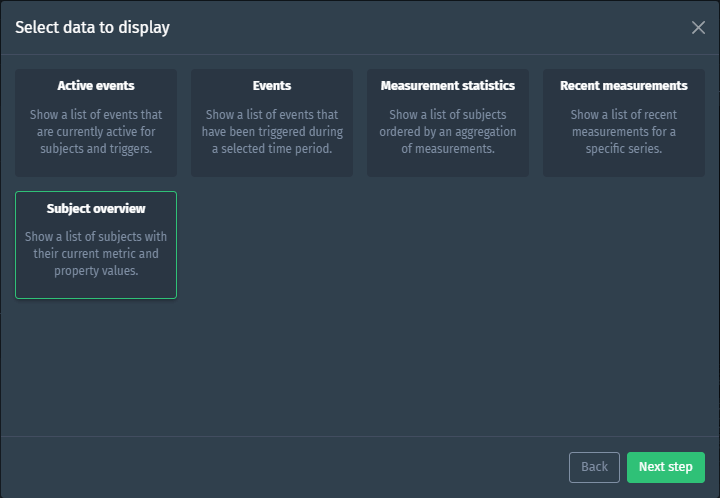
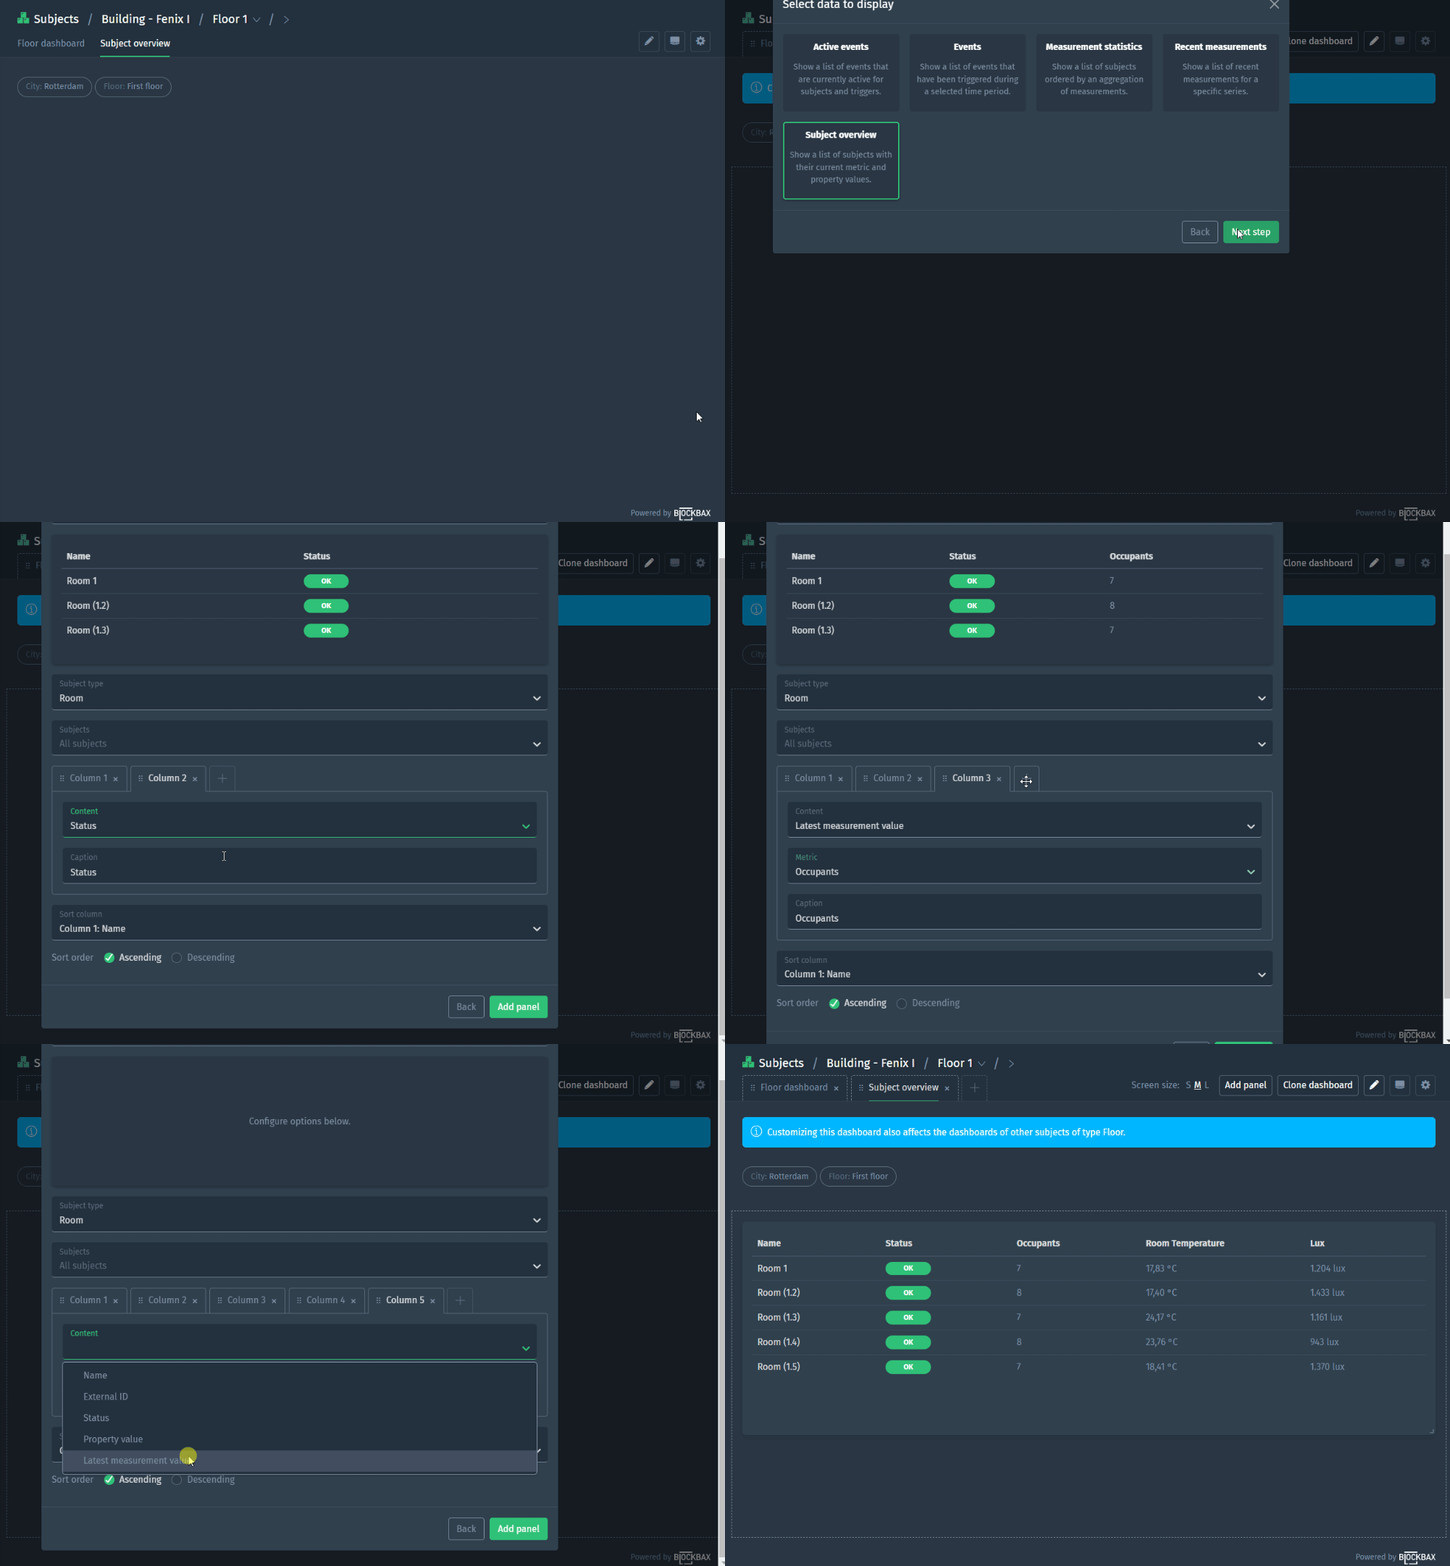
With the Subject overview you can dynamically create tables that combine subject properties, statuses as well as most recent measurements for metrics. To find the Subject overview, you will want to add a panel to a dashboard, and then navigate to the Table option. When continuing to the next step, you will now see the option Subject overview.
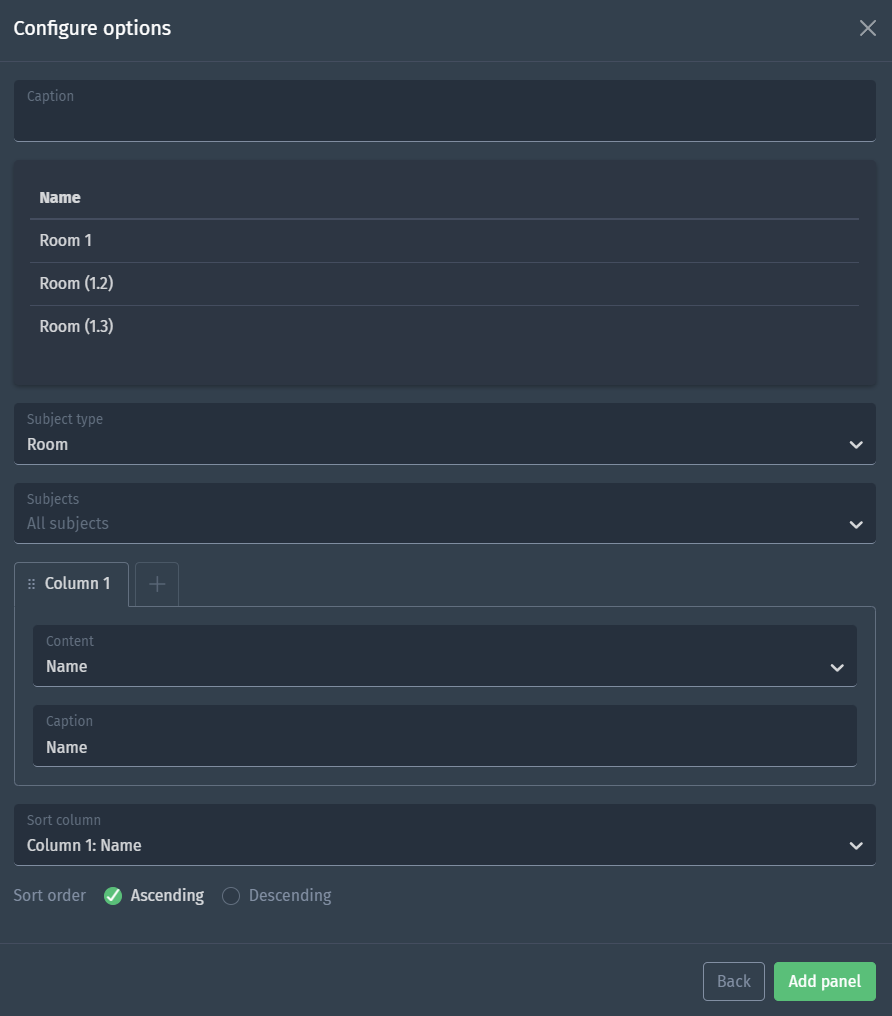
From here you can configure the widget as desired:
- Select your subject type.
- Constrain or define the subjects you would like to see in the manner you're used to
- Define columns. Columns can include subject name, external ID, status, property values as well as the most recent measurement of a selected metric.
- Select the column you would like to sort on.
Below you’ll see a Blockbaxer configuring a Subject overview that displays the children of a specific Floor (namely Rooms).
- Subject name
- Subject status
- Occupancy latest measurement
- Temperature latest measurement
- Lux latest measurement
We want to sort on Subject name, which can also be done in the configuration of the widget.
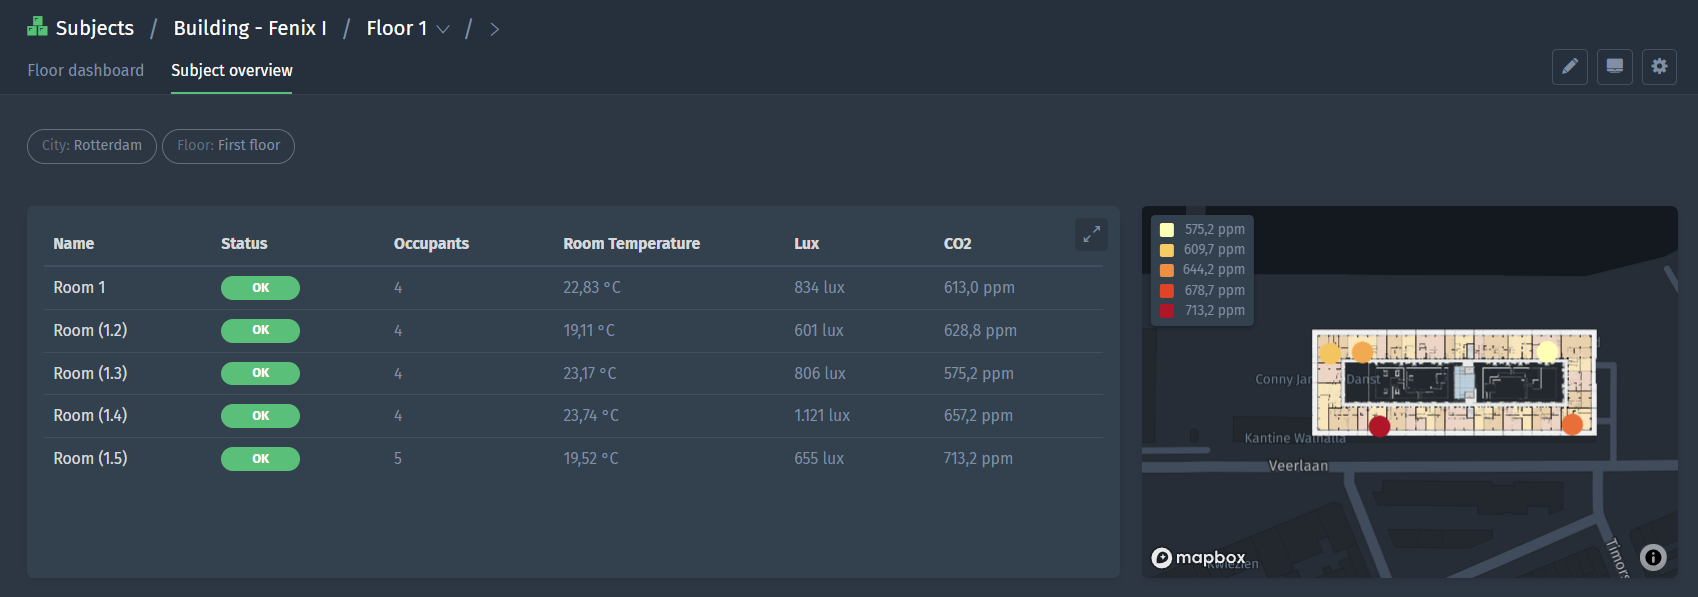
Let’s take a look at a final example of a configured Subject overview on a dashboard.
We hope you’re as happy as we are with the release of this powerful new overview!
Happy dashboarding,
The Blockbax Team
