May 14, 2020 · 4 min read
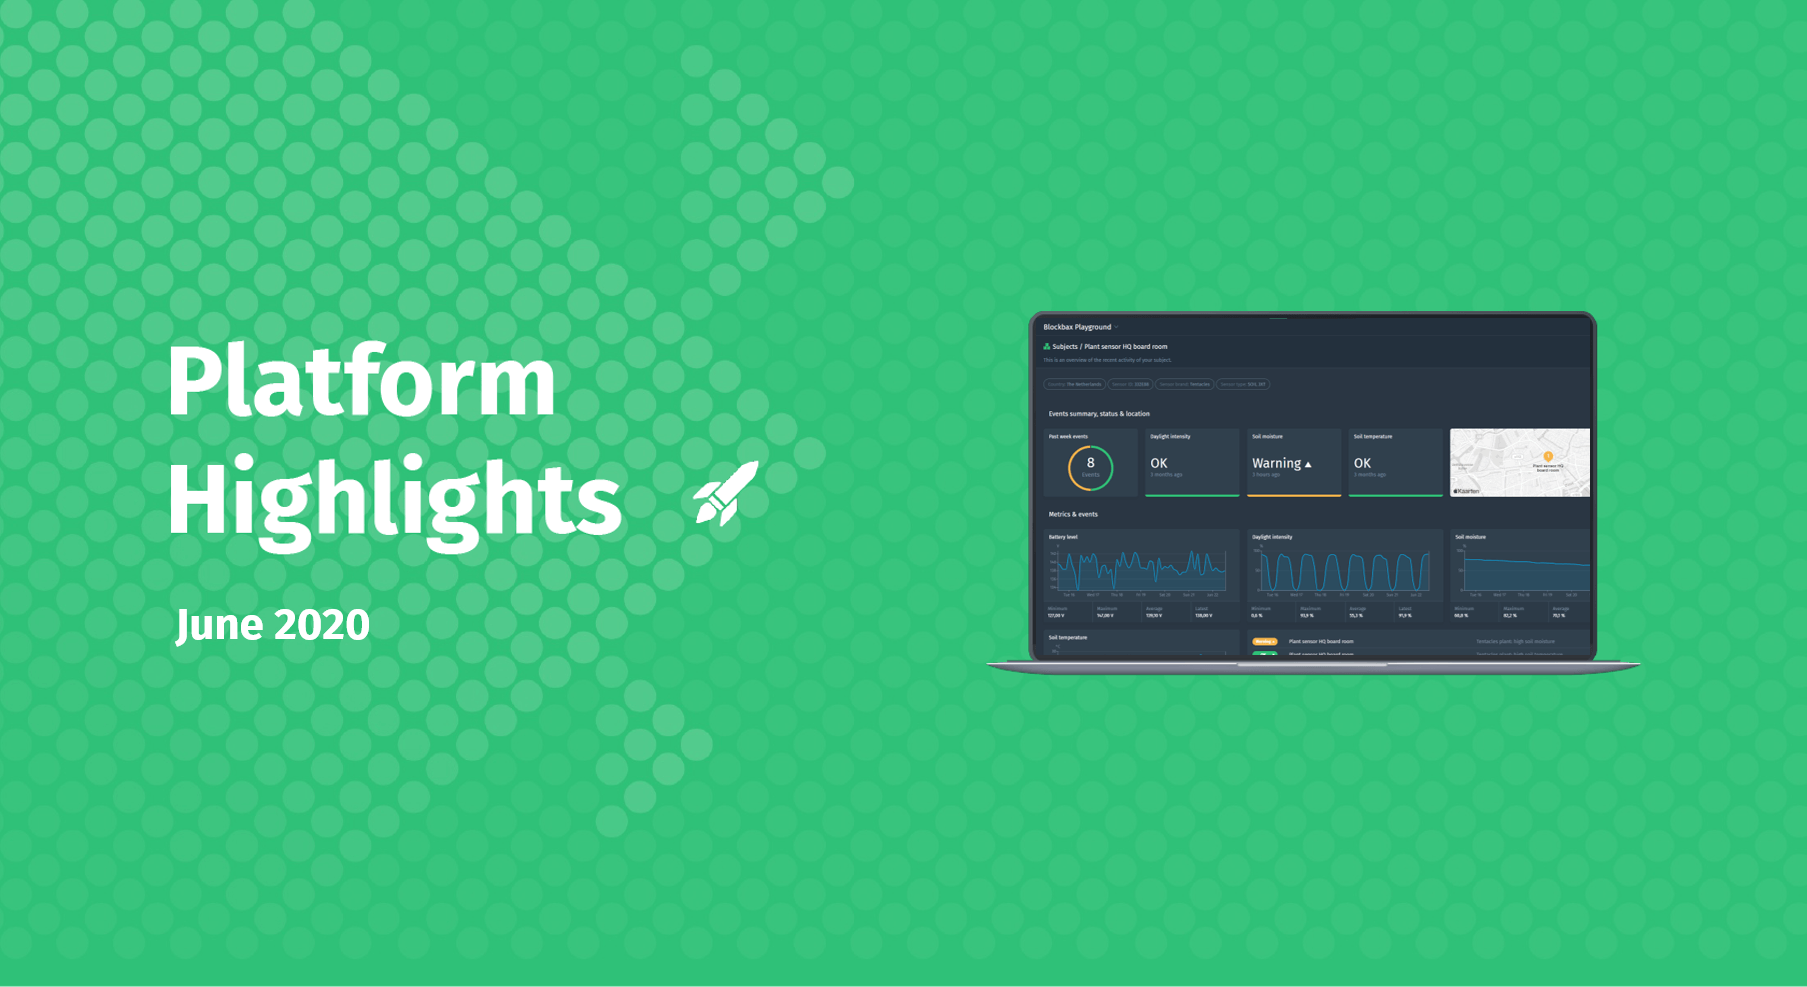
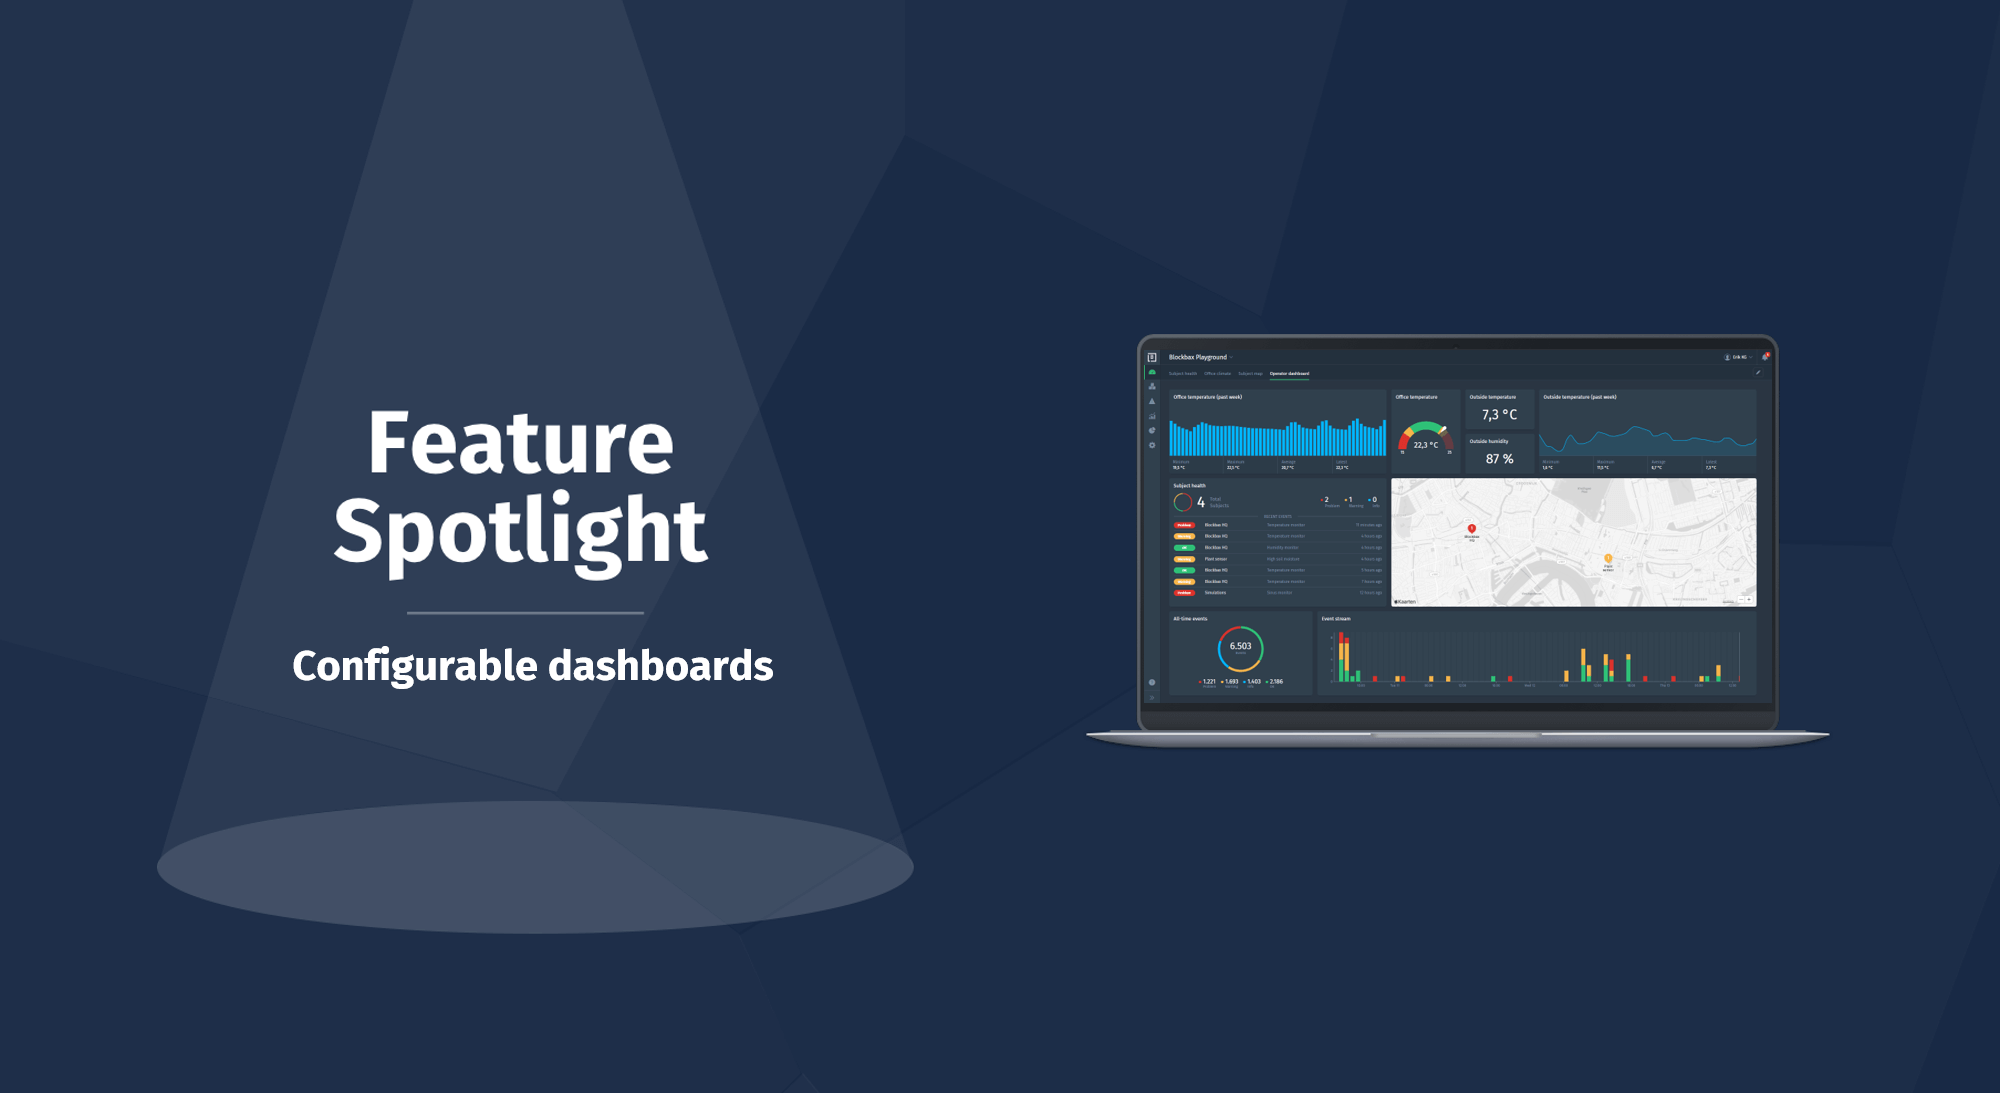
Configurable dashboards
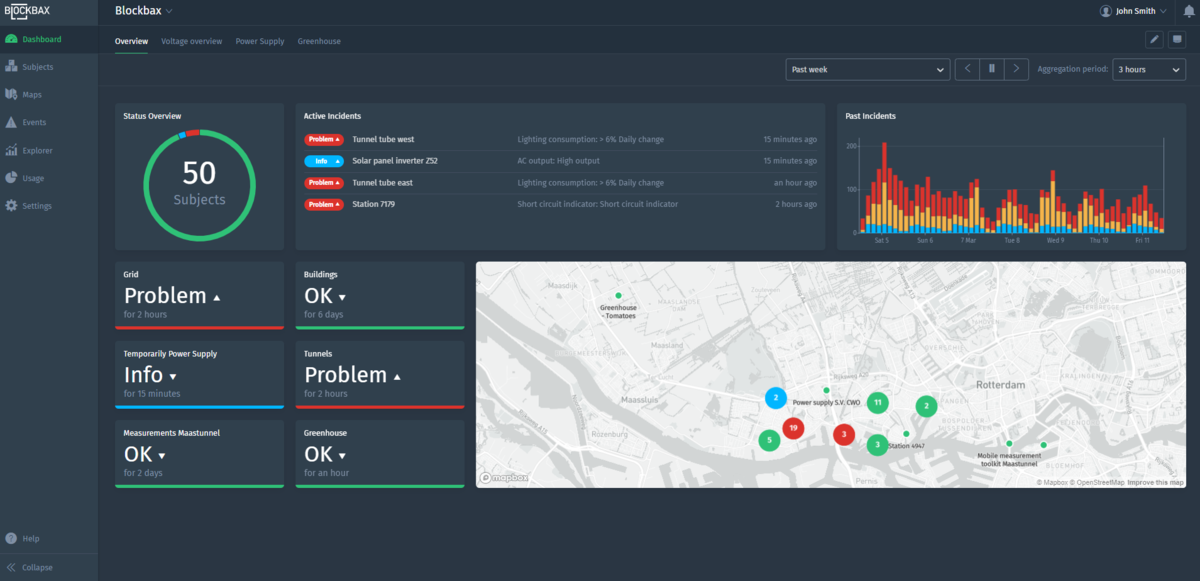
A dashboard can help you summarize your data with easy-to-understand, real-time data visuals based on measurements and events. It helps you to see the most important information at a glance, so you understand what you are doing right and where you need to take action.
Why do you want a dashboard?
A dashboard simplifies your data into more manageable chunks of visual information focused on where you need to take action. It shows you the most important and up-to-date events and metrics of your subjects at a glance, providing a way to see immediately which subjects need attention, without having to dive into individual measurements. When utilized properly, dashboards can be used to help you make informed decisions that impact business performance – which in turn effects your bottom line.
Create multiple dashboards
You might want to configure several dashboards due to the different roles within an organization. Or, each region has different KPIs which lead to different dashboards. There are many reasons why you want to see specific measurements, events or subjects on a dashboard.
More info about managing dashboards can be found in the docs.
Choose the way you like it
We started to develop the most requested widgets. The current options are shown below and we will be adding more widgets and expanding existing ones in the time to come.
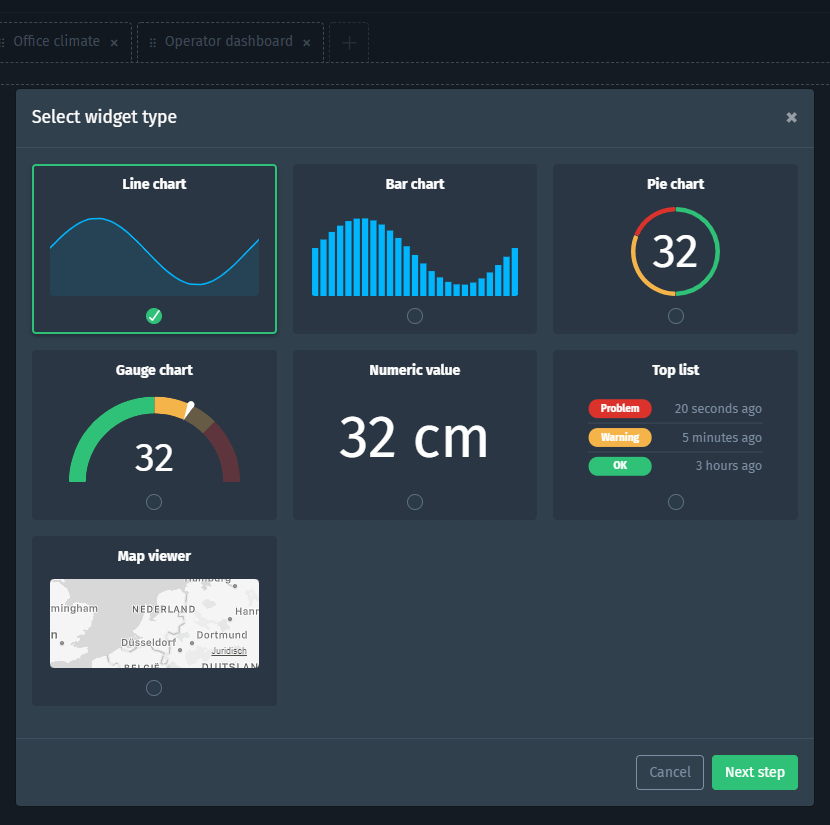
The docs about the widgets provide more info about the data to display and configurations.
See what you do
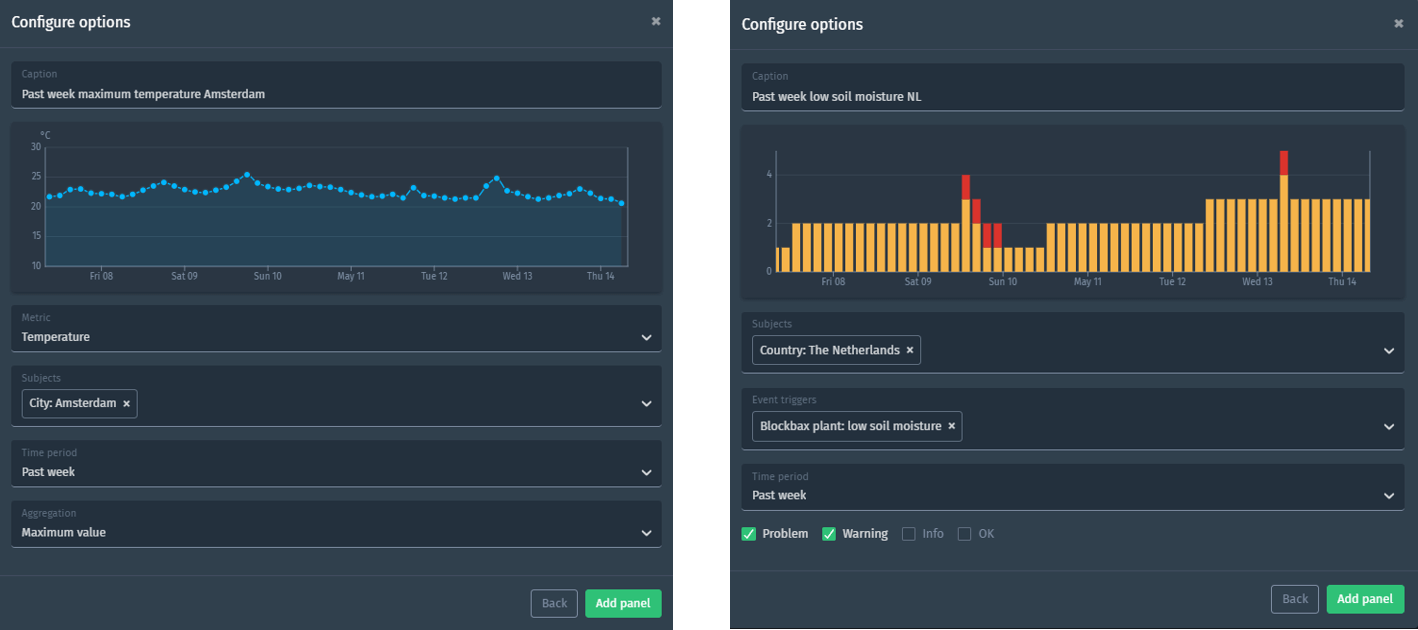
What if you directly could see how your configured widget will look on the dashboard? That’s what we thought too, so we make the result of your configuration visible while you are configuring the widget.
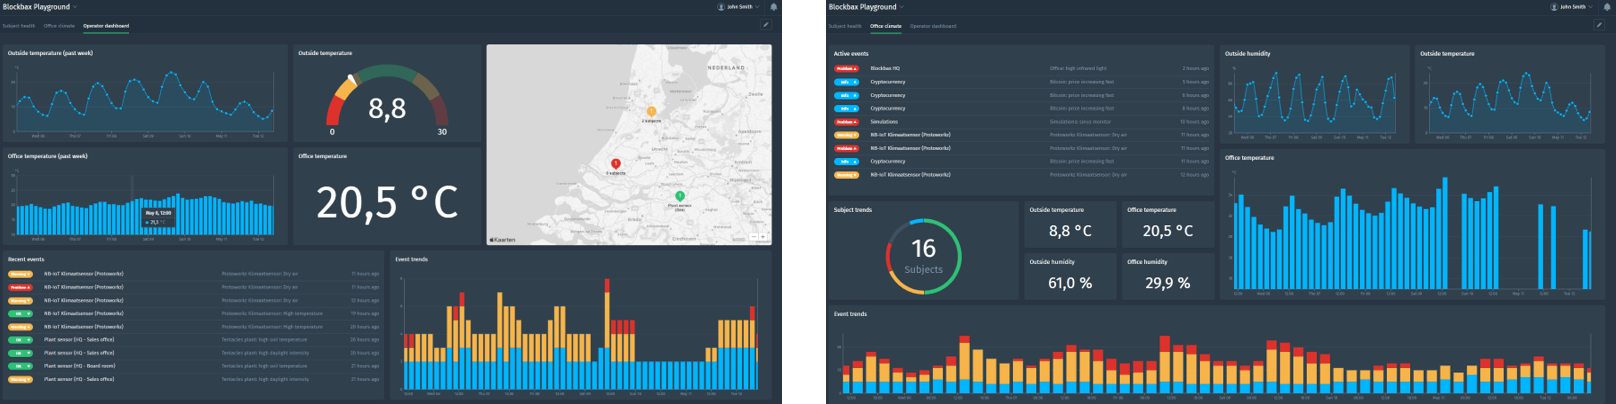
The power of aggregation
Aggregation is key, because dashboards aim to provide a high-level overview of different groups of subjects. That is why we have put a lot of effort in making it really easy and intuitive to create all kind of cross-sections of your data using properties.
We’ve made two examples:
- On the left, it shows the maximum temperature for all subjects in Amsterdam over the past week.
- On the right, it shows a list of warning and problem events for low soil moisture in The Netherlands over the past week.
Panel sizes and order
Some graphs you want bigger than others and in other cases an event trend of the past week is more important. There are numerous ways to resize your panels and you can shuffle them on the canvas until you are satisfied with what you (need to) see.
There is more to find about this topic in the docs about panel sizes and order.
Layout and screen size matters
Some of our users are watching their dashboard from a desktop (screen size L or M) at their office and others walk through a plant while checking their dashboard on a tablet (screen size M or S). So, layout and screen size matters. Each screen size has a unique layout in terms of panel sizes and order. Check it out down here.
Enjoy using this cool new feature! And stay tuned for future feature spotlights to come 💚
Cheers,
The Blockbax Team.